Investors tend to use different tools to define the market direction. Technical indicators, candlesticks and chart patterns are all key to successful trading. There is a wide range of chart patterns, one of which is triangles. Overall, we can pinpoint three types of triangles: ascending, descending and symmetrical. The ascending triangle is one of the simplest and best-known patterns. So, today we'll talk about the ascending triangle and teach you how to recognise and trade it.
Investors tend to use different tools to define the market direction. Technical indicators, candlesticks and chart patterns are all key to successful trading.
There is a wide range of chart patterns, one of which is triangles. Overall, we can pinpoint three types of triangles: ascending, descending and symmetrical. The ascending triangle is one of the simplest and best-known patterns. So, today we'll talk about the ascending triangle and teach you how to recognise and trade it.
Triangles in Trading: What Are They?
Before we talk in-depth about the ascending triangle, we should take a closer look at triangle patterns in general. A triangle is a continuation pattern that signals the market will coincide in the direction it was headed in before the pattern was formed (except in the case of the symmetrical triangle). In addition, triangles indicate a period of corrective prices. The market consolidates and, only after, moves in the direction of the main trend.
The pattern is shaped by two trendlines, the support and resistance levels, and is considered to have formed if these levels connect at least five highs and lows. It can be either three highs and two lows or two highs and three lows.
A triangle is a continuation pattern that is shaped by two trendlines. The pattern is considered to have formed if support and resistance levels connect at least five highs and lows.
There are three types of triangles: ascending, descending and symmetrical. The idea of any triangle pattern is that the price should break either the support or resistance and show the market direction.
Why is it a triangle? Because the price moves in the shape of a triangle. Look at the picture below to see for yourself.
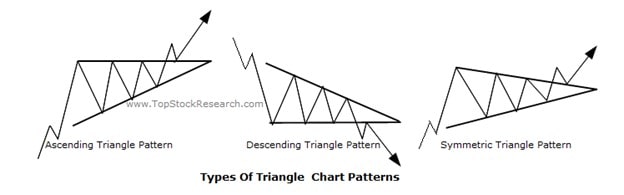
Triangles: Short Description
Here are short descriptions of triangle types.
- A descending triangle is opposite to an ascending triangle. It forms when the market experiences lower highs, thus moving the resistance line down. At the same time, the support line is horizontal. If the market falls below the bottom line, the downtrend will continue. Later on, we'll talk more about the differences between ascending and descending triangles.
- A symmetrical triangle doesn't match the idea of continuing the previous direction. Within the symmetrical triangle, the price forms higher lows and lower highs. This means the support and resistance levels meet at one point. There's no clarity on the market's further direction, and traders simply wait for the breakout. If the price breaks above the resistance level, the market will move upward. If the support line is broken, the market will drop.
You'll learn about the ascending triangle in the sections below.
What Is an Ascending Triangle Pattern, and How Does It Work?
An ascending triangle is a continuation chart pattern that relates to a group of triangle patterns. It's a bullish pattern that signals an upward movement. As you can see, there is horizontal resistance, but the lows go up, so the price creates higher lows.
An ascending triangle is a bullish continuation chart pattern that signals an upward movement. The signal of the pattern works if the price breaks above the resistance level.
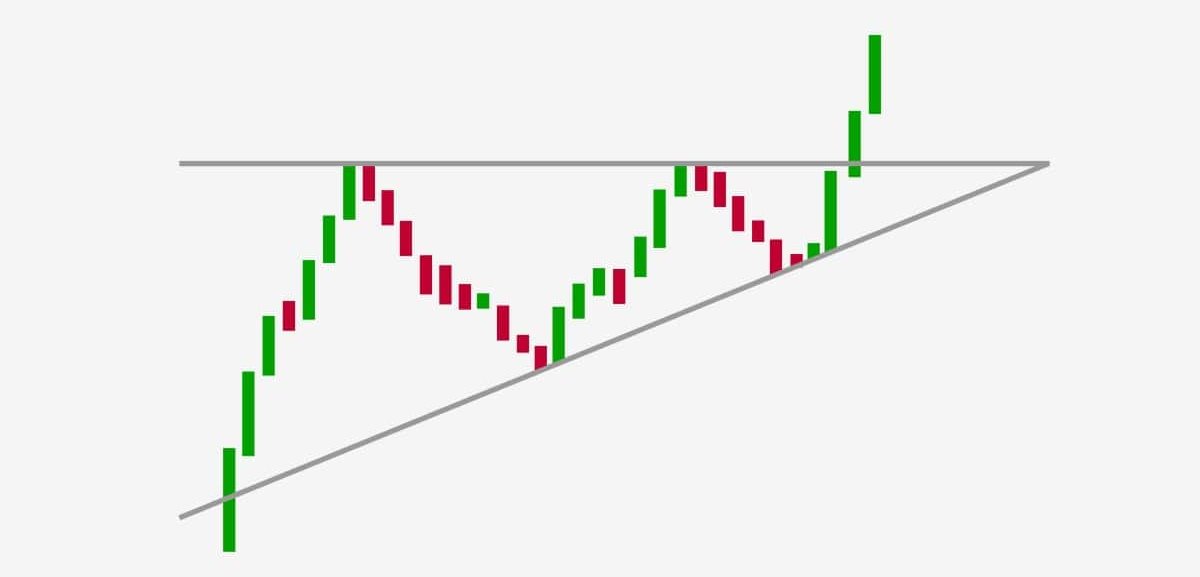
Why is it a bullish pattern? There's a resistance level, and it seems the market won't move upwards. Still, because there are higher lows, bulls have the strength to push the price above the resistance level. This isn't always the case, however. There are situations when bulls don't have the power to push the price, and the market moves sideways or goes downward.
This can happen due to unexpected market events. For instance, imagine the market has formed an ascending triangle for the EUR/USD pair, but the European Central Bank comments that it plans to loosen its monetary policy. The Euro won't have the power to move up.
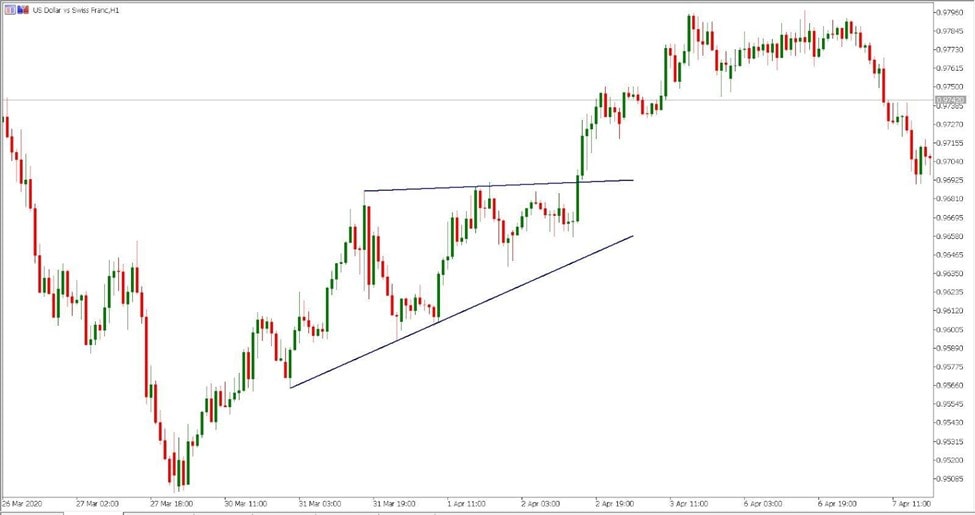
Ascending Triangle: Real Example on the Forex Market
Each chart created for educational purposes shows the pattern in an ideal form. However, it's unlikely that you'll find the same shape in the real market. That's why we're showing you a real-world example of what the ascending triangle looks like. On the hourly chart of the US dollar index, you can see the ascending triangle.
Advantages and Disadvantages of an Ascending Triangle
Any pattern or technical indicator has pros and cons. The ascending triangle is no exception.
|
Advantages |
Disadvantages |
|
|
The ascending triangle is one of the most basic patterns; you just need to draw two lines connecting highs and lows. You don't need to remember lots of information about the pattern, and it provides easy signals and works similarly for any asset, from forex to stocks. Another advantage is that you can find the pattern in any timeframe.
However, the pattern does have some limitations. The first one is that it can provide false signals, e.g., the price can break above the resistance level, but the market doesn't keep rising and instead moves below the resistance level. As we've mentioned, bulls can lack the force to push the price above the resistance. Although you can find the ascending triangle in any timeframe and for any asset, it's a rare pattern.
Also, you'll never find a 'perfect' triangle on the price chart. For instance, it's sometimes unclear whether it's a triangle or a wedge.
How to Identify an Ascending Triangle
The ascending triangle is a simple pattern, but you should keep in mind the conditions for identifying it:
- Upward movement. The ascending triangle is a continuation pattern and signals an upward movement. As such, the market should be in an uptrend before forming the triangle.
- Market consolidation. As you can see in the images above, the market consolidates within two borders. That's an important condition.
- Higher lows. The price should form higher lows, meaning that traders understand bulls have the ability to push the price up.
- Flat resistance. The upper line of the triangle should be horizontal. This line is resistance that serves as a barrier for upward movement. A price reversal from this level is expected.
- Breakout. The final phase of the ascending triangle is a breakout of the upper boundary of the pattern.
Ascending and Descending Triangles in Trading: Where the Difference Lies
Ascending and descending triangles are the opposite types of the triangle pattern. Below you can find the exact differences.
|
Characteristics |
Ascending triangle |
Descending triangle |
|
Signal |
Upcoming uptrend |
Upcoming downtrend |
|
Resistance |
Horizontal |
Lower highs |
|
Support |
Higher lows |
Horizontal |
The main difference between ascending and descending triangles is the market direction. The ascending pattern predicts that the price will ascend in the foreseeable future. Buyers wait for a breakout and open a position. As for the descending triangle, sellers anticipate the price to descend and continue the downtrend.
The main difference between ascending and descending triangles is the market direction. The ascending pattern predicts the price to ascend, and the descending triangle predicts it to go down.
The patterns look different. The ascending triangle has a flat upper boundary, while the descending triangle has lower highs. As for the bottom line, the ascending triangle has a slope of higher lows, and at the same time, the bottom line of the descending pattern lies horizontally.
How to Use an Ascending Triangle in Trading: The Best Strategies
We have a couple of the most effective strategies for you to trade the ascending triangle successfully.
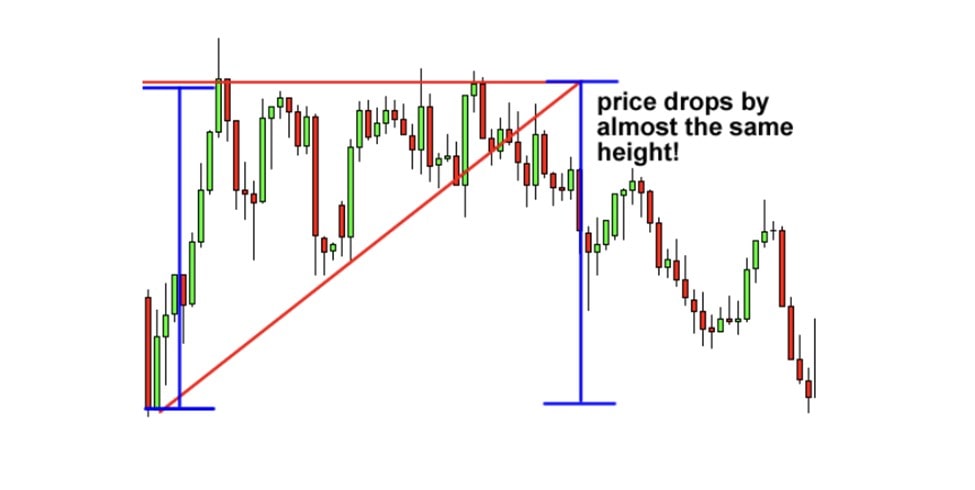
Strategy #1: Wrong Ascending Triangle
We already mentioned that the ascending triangle signals an upward movement. But that's not a strict rule: the market can move in the opposite direction if bulls aren't strong enough. This strategy will tell you how to deal with a wrong ascending triangle.
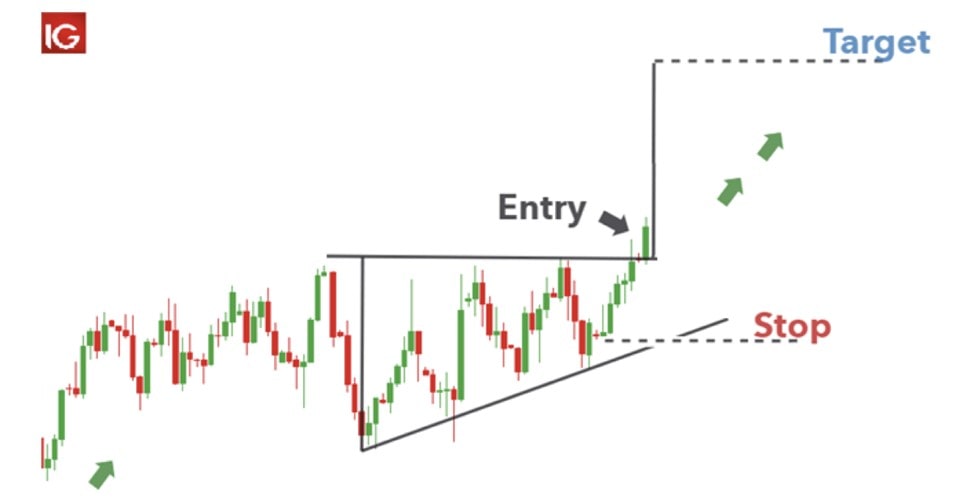
- Step 1. It's always better to wait for confirmation. Never open a trade before the breakout occurs. If the price breaks the support level of the ascending triangle, it's a signal to open a sell position.
- Step 2. Place a take-profit level. The distance can be measured very easily by counting the number of pips from the beginning of the triangle to its high. The same number of pips can be set from the high of the triangle down.
- Step 3. The stop-loss level can be placed several pips above the support line. Usually, it's 3-10 pips depending on the timeframe.
Strategy #2: A Real Triangle
This is the most common strategy for the ascending triangle.
- Step 1. Wait for the ascending triangle to form. If you remember the first part of our tutorial, we mentioned there should be at least five highs and lows.
- Step 2. Wait for a breakout. The price should close above the resistance level. Afterwards, you can open a long position.
- Step 3. Measure the take-profit level by counting the number of pips from the lowest point of the triangle to the horizontal resistance. This number should be placed from the breakout until the take-profit level.
- Step 4. The stop-loss level should be located from 3 to 10 pips below the resistance (depending on the timeframe).
Conclusion: the Ascending Triangle in Trading
Let's summarise what we've learned. The ascending triangle is a continuation chart pattern that signals an upward movement after a breakout through the resistance level. Overall, the pattern is simple. You just need to connect highs and lows with support and resistance levels.
Still, you can't always count on the triangle to work as you expected. That's why you should have enough experience to deal with the pattern. To gain that experience, you can use a trading demo account with Libertex. The account provides a wide range of CFDs instruments, in a risk free, simulated environment. It gives you a chance to hone your skills without using your own funds in conditions that mirror market conditions.
FAQ
Let's sum up the information by answering the following questions.
- How to Trade an Ascending Triangle? To trade an ascending triangle, you should open a buy position when the price breaks above the resistance level.
- What Is the Ascending Triangle in Stocks? The ascending triangle is the same for any asset you trade. That means the triangle in stocks is a bullish continuation pattern that signals a high probability of an uptrend.
- When to Use an Ascending Triangle? You should use the ascending triangle any time you see it on the chart. It's not an everyday pattern, so you should wait for it to form.
- What Does an Ascending Triangle Mean? The ascending triangle means there is a high chance the market will rise after breaking through the resistance.
- What Is an Ascending Triangle Breakout? An ascending triangle breakout is the key point of the pattern when the price breaks above the resistance level and confirms bulls' strength.
Why trade with Libertex?
- Get access to a free demo account free of charge.
- Enjoy technical support from an operator 5 days a week, from 9 a.m. to 9 p.m. (Central European Standard Time).
- Use a multiplier of up to 1:30 (for retail clients).
- Operate on a platform for any device: Libertex and MetaTrader.
 In today’s fast-paced financial world, responsible trading is no longer a choice; it's a necessity. Technology has opened the markets to everyone, making access incredibly easy.
 For active traders and investors, mastering the art of trading volatility is a crucial skill. Volatility, in financial terms, refers to the extent to which asset prices fluctuate over time. High volatility markets experience rapid price swings...
 The global financial market operates as a dynamic ecosystem, where understanding the connections between different market movements can provide invaluable insights for forecasting...
 The forex market, also known as the foreign exchange market, stands as the largest and most traded financial market globally. FXTM is committed to equipping our clients...
 Cryptocurrency trading has rapidly grown into a bustling and dynamic market that attracts traders from around the world. With the potential for significant profits...