Shares in Taiwan Semiconductor Manufacturing Company Ltd (TSM) have been making relatively stable gains in the first quarter of 2023. The company is expected to report its earnings for the fiscal quarter, ending on Thursday 13th of April. The consensus EPS is $1,21 (USD) compared to the result for the same quarter last year of $1,40.
For the past 3 years, the company has been growing its financial statements, showing more net profit and an increase in total assets. With a relatively low debt-to-equity ratio, and also a high current ratio of more than 200%, TSM looks like a financially healthy company and is an attractive addition to an investors' portfolio.
The technical indicators also show that the share of the company is still in a bullish movement further supporting the argument of an attractive investment. On the technical side, the price is regaining some ground and reached February’s high near the $100 level. At the time of this report, the Bollinger bands are slightly expanding indicating volume build-up.
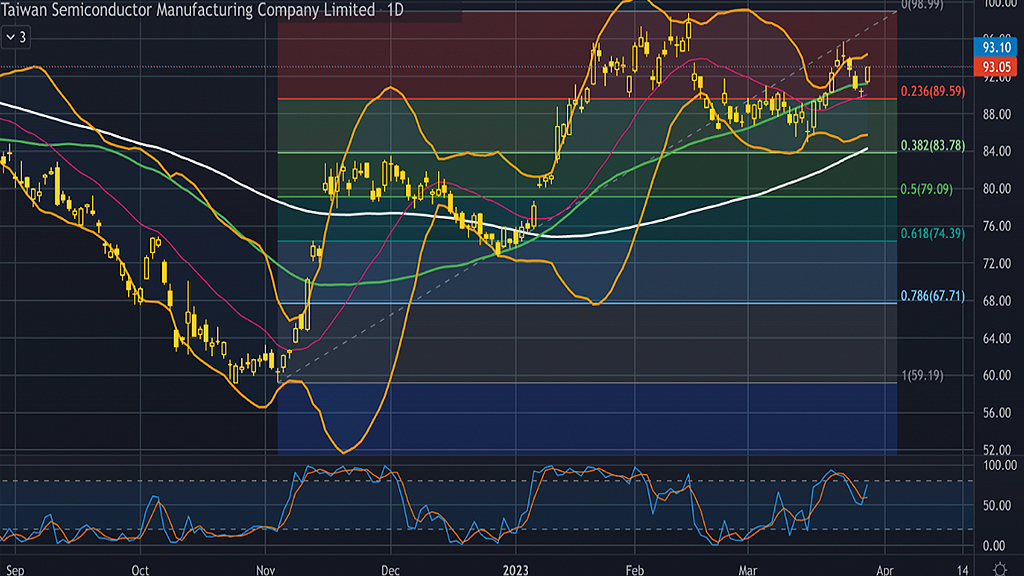
The $90 price area consists of a very strong support area on the chart because of the cross between the 23.6% of the daily Fibonacci retracement level and the 20-day and 50-day moving averages. The Stochastic oscillator is not indicating any overbought levels just yet, so the chances of another rise remain high. In the case of a rise, the first major resistance level could be laying around the $98 area which is the last area of price reaction in mid-February.
Wells Fargo: the exception to the banking industry
Wells Fargo & Company (WFC) share price has been making losses since early March after the fear of a new banking crisis spread throughout the markets, following the failures of SVB, Silvergate, and Signature Bank. The company’s earnings report for the fiscal quarter is set to be released on Thursday 13th of April. The consensus EPS for the quarter is $1.18, compared to the result for the same quarter last year of $0.88. The company’s dividend yield is more than 3%, making it a solid dividend pick among the industry, while its price-to-book ratio of 0.8x suggests it’s trading at a discount, confirming a clever pick for long-term investors and traders.
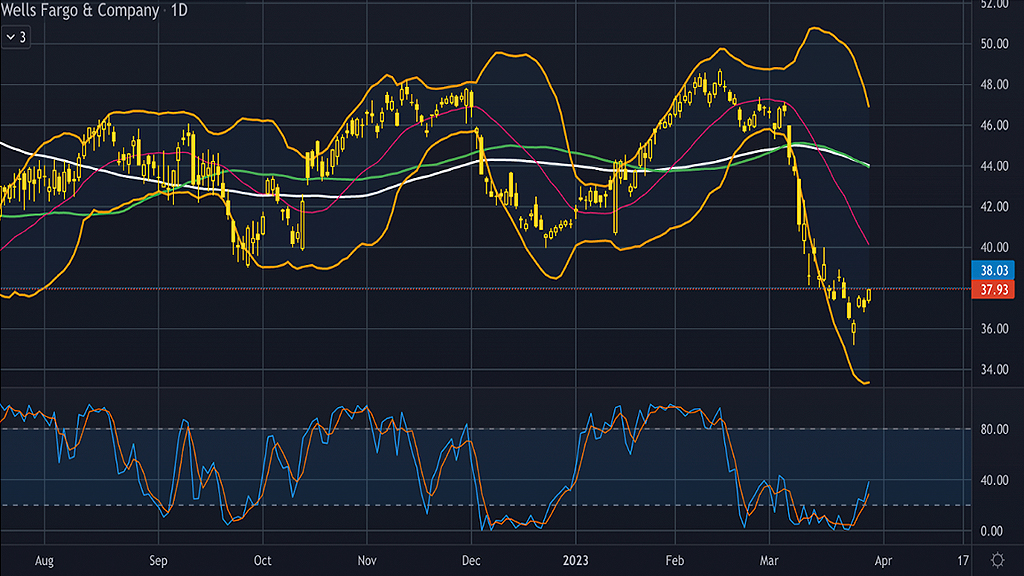
From a technical analysis perspective, the price is moving to a correction on the upside after finding support at the 61.8% retracement level of the monthly Fibonacci. The Stochastic oscillator is near the oversold level, therefore further supporting the sentiment of the bullish momentum building up. The 50-day and 100-day moving averages are without any clear crossing at the time of this report.
In the event that the bullish movement continues in the near short term, then the first point of resistance could possibly be seen around the $41 price area, which is just above the 50% of the Fibonacci level and also the 20-day moving average. On the other hand, if the price continues to the downside then we might find the support area around $35, which is the psychological support of the round number and is also just below the 61.8% level of the monthly Fibonacci retracement.
 OnsaFX has been honored with the "Best Forex Partners Programme" award at Wiki Finance Expo Dubai 2025, one of the world’s leading financial and fintech events.
 FxPro, the leading online broker, is excited to announce the full launch of TradingView integration across its trading platforms, following a successful beta phase.