Volatility is a great factor when it comes to trading and the market. Hence, market indicators were developed to help traders quantify the volatility expectations of the market. One of these is the VIX or the Volatility Index. Understanding how it works can help you in handling your portfolio well. So, what is VIX index? Read on for detailed explanations.
What Is The VIX (Volatility-Index) and How Does It Work?
It is also known as the Chicago Board Options Exchange VIX or the CBOEVolatility-Index. The VIX is a real-time index that measures the amount of near-term volatility expected by investors from the S&P 500(ticker: SPX) for the following 30 days. It’s the first benchmark to quantify the volatility expectations of the market. With VIX, the speed of the prices changing in the market can be gauged as this volatility shows the fear and sentiment of traders and investors in the market.
The S&P 500 (SPX) represents the stock market itself or the market as a whole. On the other hand, VIX is referred to as implied volatility by many professionals in the market since it can track options where traders bet on future performances of various market indices. It is available on the exchange's website. The exchange also tracks the VXN or the volatility on the NASDAQ 100 Index and the VXD or the volatility on the sector-specific Dow Jones Industrial Average.
Real-World Example of the VIX Index
One of the fears of an investor is the volatility value. And this value is always inversely connected to the movement of the market - whether it falls down or rises up. Volatility measures the magnitude of the movements of prices in a certain period. With more and rapid changes, the higher the volatility is, and the less calm the market will be.
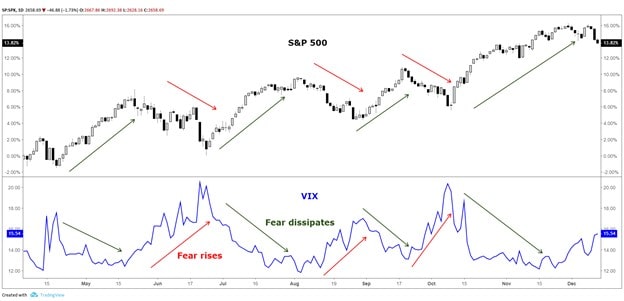
Below is a real-world example of a VIX and S&P 500 in a chart:
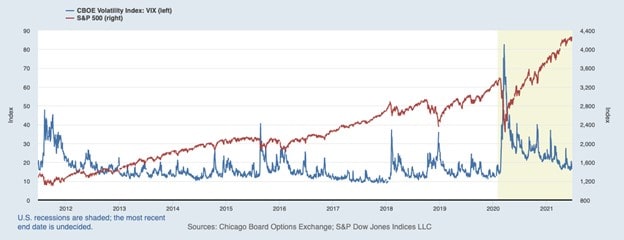
The red line in the statistically-based graph represents the S&P 500, while the blue line is the VIX index. In this real-world comparative example, which shows data from 2012 up to the present, you can see instances when the line for S&P 500, or the market, spiked, which then resulted in the VIX values dropping at the same time, as shown by the line in the graph.
Background: How Was VIX Index Created?
The volatility index, or VIX, is famously known as the Chicago Board Options Exchange’s volatility index. Before that, the traces and ideas about VIX and its creation started with the financial economics research of two partners, Dan Galai and Menachem Brenner. In 1989, they proposed the methodology for volatility indices, from indices about the stock market’s volatility to interest rates, and even up to volatility of foreign exchange rate globally. And they proposed that these be updated frequently.
And in 1992, Bob Whaley was hired by CBOE. He calculated the volatility values using the proposed papers and provided computations for the initial VIX levels. The formulation developed provided a way to measure the market volatility from which future volatilities might be expected. And currently, the VIX index value quotes the change in the S&P 500 index for the next 30 days.
VIX Formula - How Is The VIX Index Calculated?
VIX is computed from the live pricing of the S&P 500 options, which include the standard CBOE SPX options that expire every third Friday of the month and the weekly CBOE SPX options, which expire every Friday. For a price or value to be considered for calculating the VIX index, the option must expire in between 23 to 37 days.
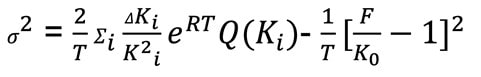
This is the formula used in calculating the VIX which CBOE provided:
 And
And 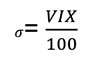
Where,
- T is the time to expiration
- F is the Forward index level derived from the index option prices
- K0 is the First strike below the forward index level (F)
- Ki is the Strike Price of the out-of-the-money option
- ΔKiis the interval between strike prices and is half the difference between the strikes
- R is the Risk-free interest rate to expiration
- Q(Ki) is the Midpoint of the bid-ask spread for option with strike
However, this formulation is too complex for people to use, especially for those who’re not good at math. That’s why to help you understand how the calculations work, let us use some values:
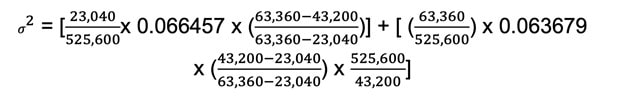
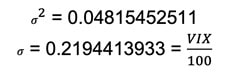
VIX = 21.94
Included and underlies in the first square bracket are these values:
- 525,600 is the number of minutes in a year, 365 days.
- Assuming that the VIX calculation time is 9:30 AM and the time to expiration, also minutes, for the 17-day option is equal to the number of minutes within 9:30 AM today and 9:30 AM on the settlement day. And excluding midnight to 9:30 AM of the two dates, the number of days to work with is 16 days. In minutes, this is equal to 16 days x 24 hours/day x 60 minutes/hr, 23,040.
- Using the same way to get the time to expiration for a 45-day option, it will be 44 days x 24 hours/day x 60 minutes/hr, which is then equal to 63,360.
- The 0.066457 value in the equation represents an assumption of the volatility of the option.
- The last value, 43,200, is the number of minutes in 30 days since VIX uses a weighted average of options with a constant maturity of 30 days of expiry.
Moving on to the next bracket, it includes all the same values from before except that the flow of calculation is different and the volatility of the next term option to be used is assumed to be 0.063679.
Using these values, the calculation is made:
- First, the number of minutes equal to the first term option, the 17-day option, is divided by the total number of minutes in a year.
- The obtained value from the first step will then be multiplied by the assumed volatility of the option.
- The number of minutes for the next term option, the 45-day option, will then be subtracted by the total number of minutes in 30 days. This value will be divided by the value obtained from subtracting the number of minutes of the first option from the number of minutes in the second option. The final value will then be multiplied to the obtained value from Step 2.
- Setting aside the final value from Steps 1 to 3, the focus now will be on the second option.
- Starting again by dividing the minutes equal to that option to the total minutes in a year. The obtained value is to be multiplied by new volatility, the volatility of the second option.
- Instead of subtracting the minutes for the first and second option, in this step, the number of minutes for the first option will be subtracted from the number of minutes for 30 days. The value from this will then be divided by the value obtained from subtracting the number of minutes of the first option from the number of minutes in the second option. The final value from this step will be multiplied to the obtained value from Step 5.
- The last part is the division of the number of minutes for 365 days by the number of minutes in 30 days. This value will be multiplied to the value obtained from the previous step, Step 6.
- The final value from Steps 1 to 3 will be added to the final value from Steps 5 to 7. The square root of the obtained value from this operation will be acquired and will be multiplied by 100 to get to the final value, the VIX.
The Correlation Between the VIX Index and the S&P 500 and More
From the previous sections, the correlation of the VIX index and the S&P 500 is clear - they move relative to each other. From the sample chart before, you can infer that they have a strong negative correlation with each other.
The falling or drop in the stock market results in an increase or spike in the VIX index. This can be observed even during the 1990s, where the correlation between the changes of the two reached -77%. And even a decade after that, it continued to gain strength and reached -81%. The tight correlation of the two allows people to trade VIX. And this relationship has been consistent through the years, only changing within the ranges of -70% to -90%.
What Happens If the VIX Index Goes Down?
Remember that the VIX index is used to predict the volatility of the market level, so it indicates essential details about the market through its movement. The stock market fluctuates and rises gradually, and because of their correlation, the VIX will also decline or fall in a gradual manner. This results in low levels of volatility and complacency. When VIX is low, investors and traders are complacent, and protection isn’t a priority for them.
When the CBOE Volatility Index went down and is low, the fluctuations are also low; hence the volatility is low too. When volatility is low, the value does not change dramatically. It is steady. And this suggests that it would be a good time to sell stocks in the market.
What Happens If the VIX Index Goes Up?
The opposite happens when the VIX index goes up. This would mean that there is great or high volatility and fluctuation of prices ahead in the market. This usually happens when the S&P 500 drops since they have an inverse relationship with one another. Traders and investors tend to overreact when the market declines. That's why the VIX is also referred to as the fearbarometer of the market participants.
When the VIX spikes during a period of time when the market is under stress, it can be used as a signal that selling’s overdone, and the market is more than likely to spike back or move higher. And when the VIX rises, investors usually consider shifting their portfolios to assets that seem to be less risky such as bonds.
Trading the VIX Index
The VIX-linked index is used by many for trading due to its very characteristics and correlation with the stock market. Traders and investors include VIX-basedinstruments in their choices for hedging, pure speculation, and diversification. When they take positions on the VIX, it’s possible for them to balance out their stock positions in their portfolio and hedge their exposure in the market.
There are five major steps in how you can trade the VIX. These are:
- Research and understand the VIX index: how it works and how to calculate it.
- Understand the VIX values.
- Decide if you will spread bet or trade the CFDs.
- Choose if you’ll go long or short on the VIX
- Create a live account or practice through a demo account.
Step 1 - Research and Understand the VIX Index
There are a lot of things you need to research and understand for this first step. However, you mustn’t skip this step since it’s an essential part of how you can trade VIX. The VIX tracks the price of the S&P 500 options and not the stock market itself. These options are contracts that obtain their prices from the Standard & Poor’s 500 (S&P 500). Traders are given the rights to trade the S&P 500 at a set price and before a set date of expiry.
You may encounter a call option or a put option. The call option will allow you to buy the S&P 500 at a specific price, while a put option will allow you to sell the S&P 500 at a specific price. These prices are then called strike prices.
Aside from the options, you must know how the VIX is calculated. A detailed explanation of how you can calculate the VIX is already mentioned here before. Although it’s not necessary for you to learn and understand it in order to trade since it involves complex mathematics, it’s good knowing that you know how the future volatility of the S&P 500 is estimated or predicted.
Step 2 - Understand VIX Index Values
The strong correlation between the VIX and the S&P 500 has been mentioned and explained before. When one goes up, the other goes down. And when the VIX declines, S&P 500 will likely be stable and would cause no stress to the traders and investors. However, it doesn’t always mean that trading volatility is a market downturn since the probability of low volatility during a decline in the market is high.
During the past years, if the VIX was trading below 20, the market is stable for the time being. And when it reaches 30 or higher, it means the volatility is high.
Step 3 - Spread bet or Trade CFDs on the Volatility Index
You have two choices - to spread bet on the VIX or perform CFD trading on the VIX. Spread betting involves betting on which direction the volatility levels are heading to. And the further the VIX moves in your predicted direction, the higher potential profit you may gain. And as it moves against that, you can possibly lose more. Additionally, your potential loss or gain will depend on the size of your bet at each point of movement. The advantage of spread betting is that your potential profits will be tax-free.
CFD trading on the VIX, on the other hand, is equivalent to agreeing in an exchange-traded method. This is agreeing to exchange the difference between the prices from opening the position and closing it. The conditions of this method are similar to spread betting. The more the VIX moves in your predicted direction, the more potential profit you can get, and vice versa. However, unlike spread betting, your potential profit isn’t tax-free.
Step 4 - Go Long or Go Short With the VIX Index
Opening a position on the VIX will give you two basic positions you can opt to take - either long or short. Don’t forget that volatility traders don't care if the S&P 500 price will rise or fall since they can capitalize on either of the two. They’re interested instead whether the market is volatile or not. And the position any trader will make depends on what their expected volatility level is.
Going Long
Going long on the VIX means that you believe that the volatility will increase; hence the VIX will also do so. This is a popular position for traders, especially during financial instability moments when the market is full of uncertainty and stress.
For example, if you predicted or expected that the S&P 500 is going to have a major and rapid decline after a political announcement, you’re likely to take a long view of volatility. To do this, you just have to open a position you can use to buy the VIX. If there is indeed volatility and your prediction is right, you can gain potential profit. But, if there’s none and you take a long position, you’re likely to suffer potential losses.
Going Short
Taking a short position on the VIX means that a trader expects a rise in the S&P 500 value. This is famous, especially when the interest rates are low where there is reasonable growth in the economy and low volatility across markets.
For example, the S&P 500 constituent’s share prices grow steadily from a combination of low volatility and high growth in the economy. You can choose to go short while expecting that the stock market will continue to rise while the volatility remains low. If it does happen, you can expect that the VIX will move lower, and you can get potential profit. However, shorting volatility is risky since you may encounter and acquire lots of potential losses if the volatility spikes.
Step 5 - Live Account or Demo Account in Trading the VIX Index
After all the previous steps, you can now try to trade the VIX index. You can easily do this by creating and opening your own live trading account. In this account, you can choose what type of trading you prefer. However, remember that you can lose and gain money or funds with a live account. If you don’t want to lose funds or money, you may opt to practice trading the VIX using a demo account where you can generate personalized strategies.
Key Points About the Volatility Index
The VIX indicates various things in the markets. And even if it’s simply a prediction of what volatility is expected in the market, it’s important that you know how to apply it practically. Here are some key points regarding the VIX:
- The VIX is a great and sound measure of risk in the market for the traders in equity. It can give them and also short-term traders ideas and estimates about the possible movement of the volatility in the market and use them for their strategies. With this, intraday traders can reduce their leverage or increase their stop losses when the volatility is likely to spike.
- Long-term investors can also utilize the VIX as indicators even if they’re not usually bothered by some short-term volatility. But they can also utilize the VIX to increase their hedges in the form of puts when the VIX is likely to show a rise in volatility.
- As mentioned, the VIX can also be used as an indicator in options. If there’s a possibility of the volatility rising, options tend to be more valuable, and the ones to possibly gain more are the buyers. And when it’s the opposite, the sellers will have more potential to benefit.
- When trading volatility, you can buy futures on the VIX index itself to benefit from it and not worry which direction the movement of the market will go. You can do this instead of buying straddles or strangles since they cost too much when volatility is rising.
- Portfolio and mutual fund managers view the VIX as a valuable tool. When the VIX peaks out, they can increase their high beta portfolio exposure and add on to low stocks of the beta if it bottoms out.
Conclusion
The VIX index is beneficial if used and applied correctly. With the knowledge and understanding about it, you can start by practicing how to trade the volatility index. The best way to do this is using a demo account from Libertex. With the Libertex demo account, you can experience trading the VIX in the same manner you can trade it with a live account but in a completely risk-free way.
Why to trade with Libertex?
- access to a demo account free of charge
- technical assistance to the operator 5 days a week, from 8 a.m. till 8 p.m. (Central European Standard Time)
- leverage of up to 1:999 for professional clients
- operate on a platform for any device: Libertex and Metatrader
FAQ
What Is the Volatility Index?
The Volatility Index or the VIX is an index from CBOE. It is used to measure and predict the amount or level of volatility the S&P 500 will have for the following updated 30 days. It’s perceived by many as an indicator of when traders and investors can make bets about future market performances.
How Does the Volatility Index Work?
The Volatility Index has a negative correlation with the S&P 500. When the latter spikes up or moves higher, the VIX will decline. This will indicate that you can expect low volatility. And the opposite applies when the S&P 500 declines. Additionally, the VIX works based on a standard deviation formula and is a derivative from the theory developed even before CBOE used it.
How to Invest in the VIX Volatility Index?
The best way to invest in the VIX is to trade. Like normal trading, trading in the VIX can lead to potential gains or losses. However, if utilized correctly and properly, you can take advantage of it and possibly gain profit when you invest in it.
What Does the VIX Index Tell Us?
The VIX is a real-time volatility index, and it quantifies the expected volatility of the market. However, this is forward-looking and only shows predictions of the volatility of the S&P 500 for the following 30 days. To put it simply, when its value rises, the S&P 500 is likely to decline, and vice versa.
What Does It Mean If the VIX Index Is Down?
In instances that the VIX is down, it means that the S&P 500 is rising or moving higher in a gradual manner. This also means that the VIX value is declining. And when it’s declining, you can expect stability and low volatility with the S&P 500.
What Does It Mean If the Vix Index Is Up?
If the VIX spiked or is up, its value is increasing. With an increase in value, there’s also an increase in volatility, and the S&P 500 is likely to be declining. This also shows the fear of the traders and investors since there’s high volatility and the fluctuation of price swings rapidly.
How Do You Analyze the VIX Index?
Analyzing the VIX index is simple and can be done by observing the index. If you observe the VIX declining, the volatility is low, and if it’s rising, the volatility is high. However, if you prefer using an advanced and complex method, you can try calculating the VIX in order to analyze it.
Should I Buy When the Volatility Index Is High?
Selling stocks is a good choice when the VIX is low. So when the VIX is high, it’s a good choice to buy if you’re bearish on the stock. However, remember that a high VIX value means that the volatility is also high.
Why Does the VIX Index Go Down When the Market Goes Up?
The correlation between the VIX and the S&P 500 or the market is clear as they move relative to one another. They are negatively correlated. That’s why when the market spikes, the VIX declines. Also, when the market goes up, it increases gradually. Hence the fluctuation of prices isn’t much, resulting in low volatility and the VIX going down.
 In today’s fast-paced financial world, responsible trading is no longer a choice; it's a necessity. Technology has opened the markets to everyone, making access incredibly easy.
 For active traders and investors, mastering the art of trading volatility is a crucial skill. Volatility, in financial terms, refers to the extent to which asset prices fluctuate over time. High volatility markets experience rapid price swings...
 The global financial market operates as a dynamic ecosystem, where understanding the connections between different market movements can provide invaluable insights for forecasting...
 The forex market, also known as the foreign exchange market, stands as the largest and most traded financial market globally. FXTM is committed to equipping our clients...
 Cryptocurrency trading has rapidly grown into a bustling and dynamic market that attracts traders from around the world. With the potential for significant profits...