Today, there are almost 19 thousand cryptocurrencies in the world. On the one hand, this is a huge opportunity! For comparison, only a few thousand companies are represented on one of the world’s largest stock exchanges – the New York Stock Exchange (NYSE). On the other hand, such a wide choice can confuse any novice crypto trader. How to start trading cryptocurrencies?
How to choose the best cryptocurrencies for trading? What crypto trading strategies are suitable for beginner traders? We understand below in the article.
Cryptocurrency trading: where to start?
We suggest not to delve into the theory and go straight to the practice of trading. How to trade effectively? Analyze the actions of professional traders and at first repeat after them.
Professional traders are divided into two categories according to the type of search for trading signals:
- Professionals in technical analysis. These include those who are guided mainly by technical analysis and, on its basis, can open transactions on almost any cryptocurrency instrument.
- Narrow crypto trading masters are highly focused specialists who study key trends within several crypto instruments and open deals mainly when fundamental reasons appear.
Generally, cryptocurrency trading for beginners doesnotdistinguish from professional trading. Both open and close deals to buy and sell in order to earn speculative profits. The only difference is that professional traders receive income more consistently.
Learning to trade cryptocurrencies: basic principles
The basics of cryptocurrency trading are practically similar to classic trading in the financial markets. In other words, a professional trader in the market of major currency pairs – EUR/USD, GBP/USD, AUD/USD, and others – will be able to quickly understand the critical cryptocurrency technical and graphical patterns.
Let’s consider a simple algorithm for trading cryptocurrency. The article will analyze the best cryptocurrencies for trading and effective trading strategies.
Choosing a timeframe for work
Is it more convenient for you to open a trade and keep it open for a couple of days, or do you prefer scalping? Trade on M30, H1, and H4 timeframes in the first case. In the second one – M1, M5, and M15. In this case, “M” stands for “minute,” and “H” stands for “hour.” Accordingly, “M15” indicates that each candle considered on the chart contains information for 15 minutes.
Many novice traders ask themselves: “What is the best timeframe for trading cryptocurrency?” The answer is simple: “The one that you are most comfortable with.” On average, 350–450 candles are placed on the screen, depending on its size. Therefore, if you open the H1 timeframe, then the history for the last 18 days will be immediately available to you. If M1 – then for the last 8 hours.
The larger timeframe you choose – H4 is more prominent than H1 – the more accurate information you get when analyzing the chart.
Focus on specific cryptocurrencies
Firstly, select a few tools and study them thoroughly: who created them and why; what is their average trading range for the period; what are the prospects for their further use. Even if you don’t plan to dive deeply into each cryptocurrency in the future, at this stage, you will be able to identify the main factors that you are comfortable considering when making decisions about opening and closing positions.
Search for the best patterns in historical data
Determine on historical data which patterns “work” better. This can be done manually or using automated programs.
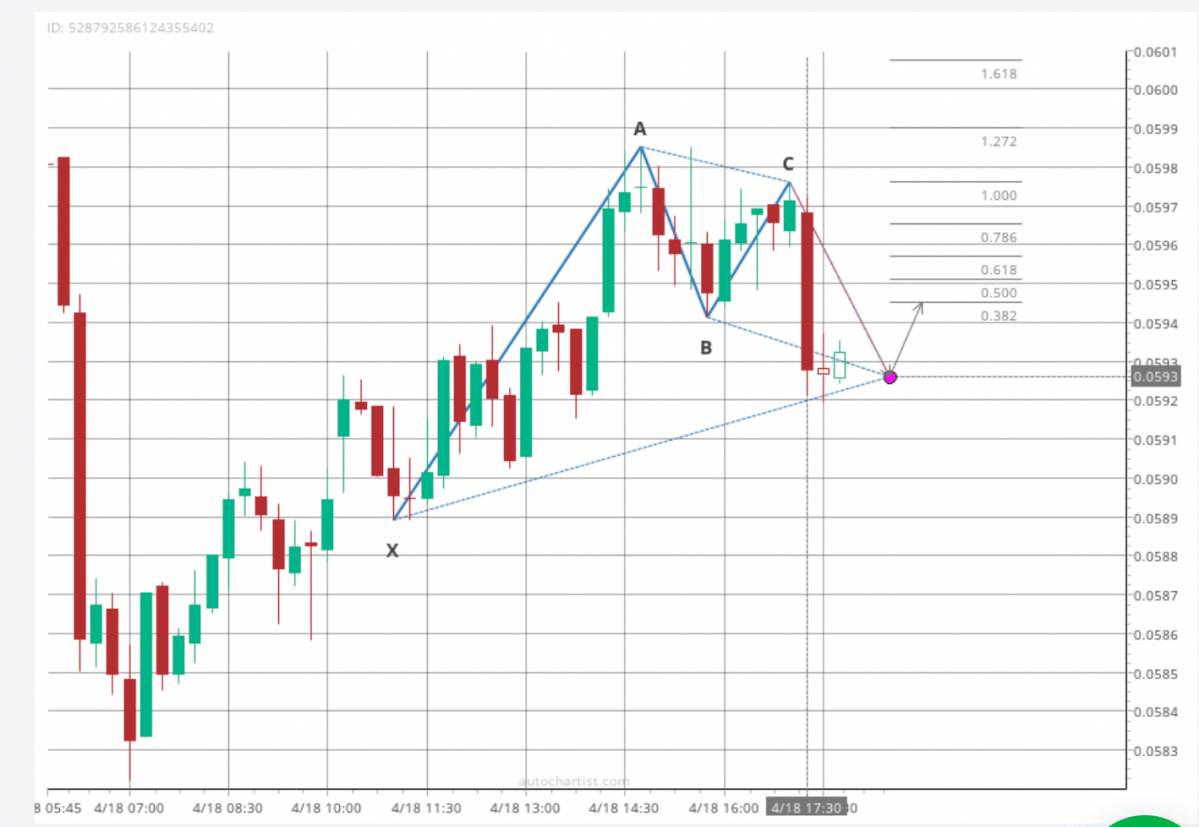
Signals from the Autochartist service and a chart of quotes for the TRX/CHF cryptocurrency pair with Fibonacci targets for price growth, M15 candles. Date of access: 04/18/2022.
The figure above shows an example of a chart pattern generated using the AutoChartist automated program. The program constantly analyzes dozens of trading instruments for the appearance of graphic patterns and when they are formed it signals to the trader. The chart shows a complex Gartley Butterfly pattern, consisting of several waves and indicating a subsequent increase in quotes.
To get free access to AutoChartist trading signals, simply:
- open your AMarkets personal account, and
- in the “Services” window, click on the “Trading Signals” icon.
Get the best graphical analysis signals and earn!
Pattern testing on accurate data and earnings
Find these patterns in real-time and earn. Traders who use primarily technical analysis believe that history is repeating itself. Therefore, if you have already determined on historical data that specific analytical models using indicators or chart patterns perfectly signaled the continuation or reversal of a trend, test them in practice.
Have doubts about the developed strategy? Feel free to test it on a demo account without the risk of using actual quotes!
Best cryptocurrencies to trade
Let’s highlight the top 5 cryptocurrencies you can trade right now.
- Bitcoin (BTC/USD). The popularity of Defi projects, the development of the NFT infrastructure, the legalization of bitcoin by El Salvador as an official means of payment, and the launch of the first ETF on the US exchange – should ensure a significant increase in the bitcoin rate as early as 2022.
- Ethereum (ETH/USD). According to data, on April 19th 2022, Ethereum is the second-largest cryptocurrency in market capitalization after Bitcoin, with almost $375 billion.
- Experts are inclined to believe that in the long term, Ethereum is one of the most promising cryptocurrencies due to the volume of tokens used and the breadth of opportunities: not only the storage and sending of funds – as is the case with BTC / USD, but also investment, depositing and other actions.
- Ripple (XRP/USD) was created to increase the efficiency and speed of interbank transactions using blockchain technology. The Ripple exchange rate is growing due to an increase in the number of unique addresses, the implementation of new products, and the periodic redemption of tokens by the company itself.
- Stellar (XLM/USD) encourages the facilitation of cross-border money transactions. Technically, the cost of one coin is now relatively low: to update the historical maximum, it needs to grow by 270%. In contrast, bitcoin only needs to increase by 65%.
- Cardano(ADA/USD) is one of the most promising assets in the Defi sector. With its help, it is planned to modernize the education system in Ethiopia. In addition, Cardano can be used in the financial sector, trade, and healthcare.
Earn in financial markets today! Follow daily updated trading ideas on the website and in Telegram and become richer every day!
Patterns in cryptocurrency trading
Before proceeding directly to the description of chart patterns, let’s consider a fundamental concept that many people forget about: the correlation between trading instruments.
Correlation between cryptocurrencies
Correlation is the degree of relationship between the cryptocurrencies in question. It can vary from -100% to 100% (or -1 to 1). A high positive correlation indicates that asset values are moving in a pattern or are nearly identical.
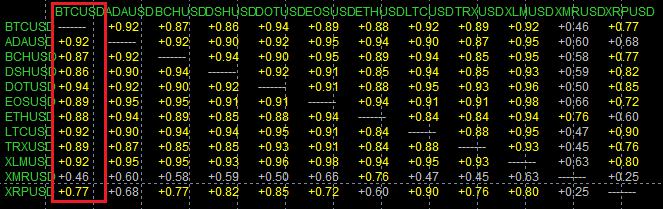
Correlation between cryptocurrency quotes based on 300 H4 candles from 04/18/2022. MetaTrader 4 trading terminal
In the figure above, the red box represents the correlation between BTC/USD and other cryptocurrency instruments. For example,10 out of 12 cryptocurrency pairs correlate with Bitcoin by at least 87%. In this case, this indicates a very high dependence of the rate of these cryptocurrencies on the dynamics of BTC/USD. A similar correlation is observed between Brent and WTI oil,which are almost a single asset. In other words, a high positive correlation between crypto-assets indicates their interdependence.
As a result, the BTC/USDdynamics chart is primary in analyzing cryptocurrencies since most of them repeat the movements of bitcoin.
Fibonacci in cryptocurrency trading
Consider one of the most popular and no less effective tools for setting Take Profit and Stop Loss goals in cryptocurrency trading – the Fibonacci Retracement line. Fibonacci levels are targets used by traders around the world. The levels are a set of values: 38.2%, 50.0%, 61.8%, and others.
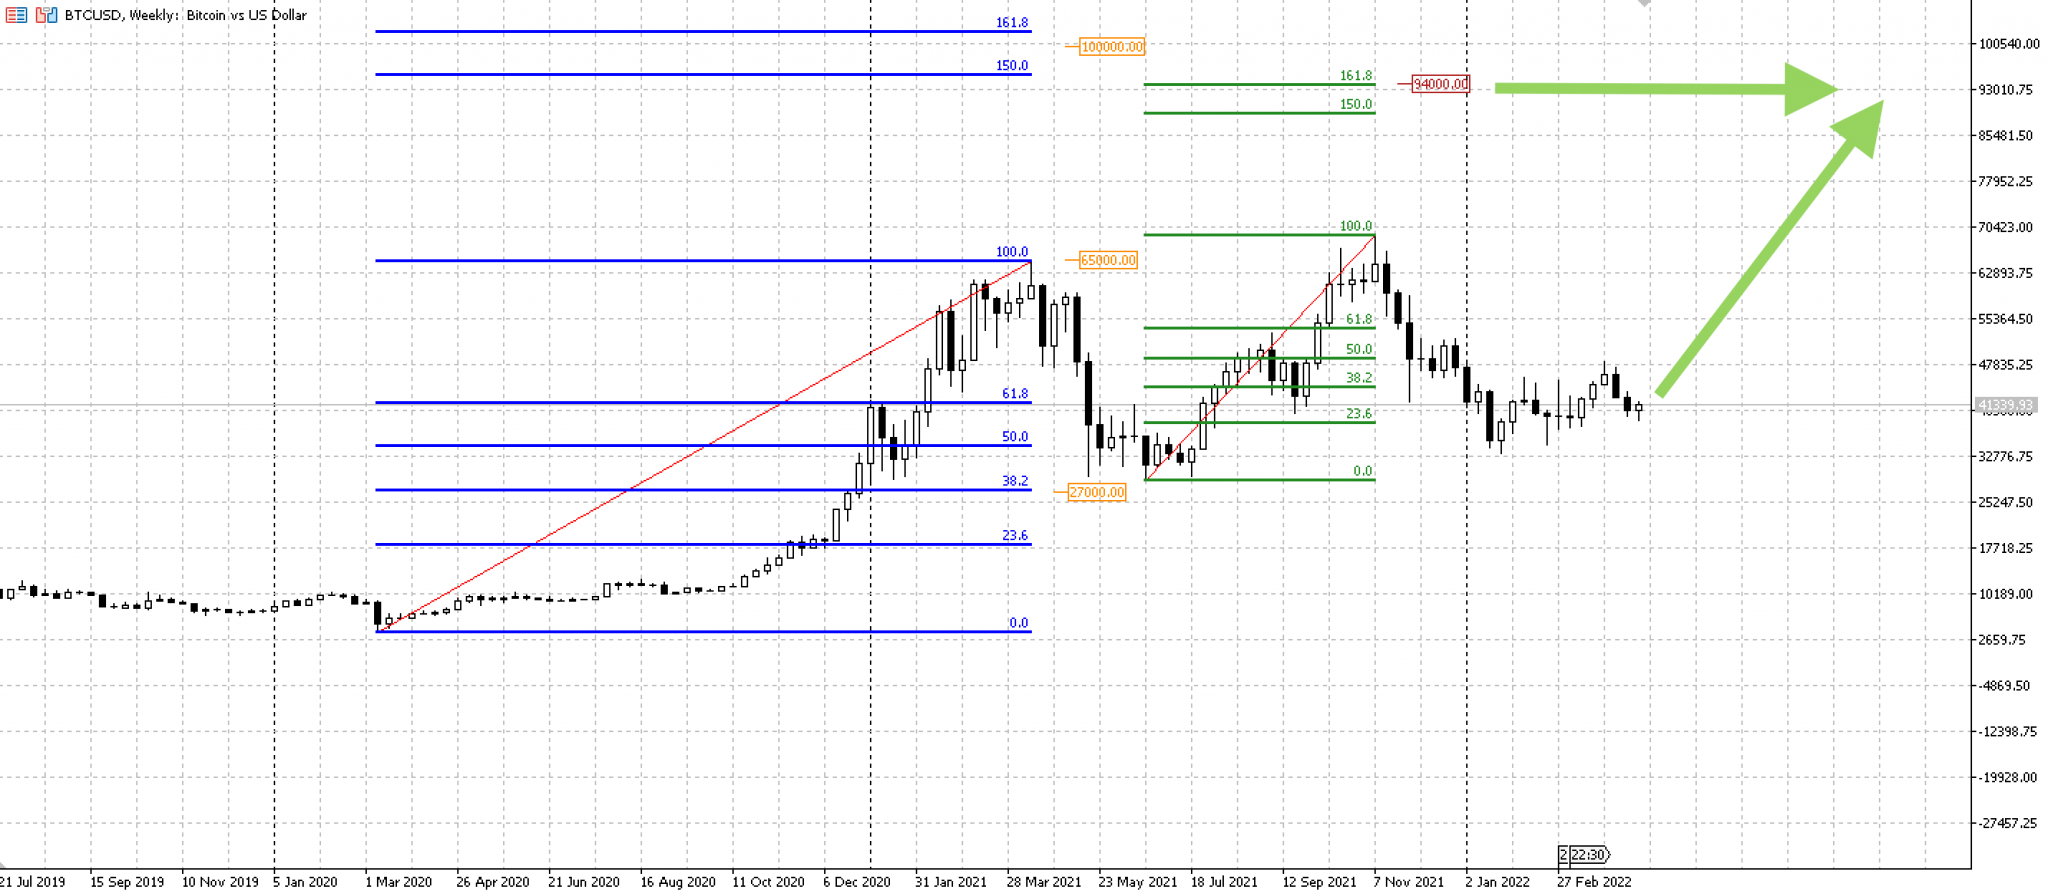
The dynamics of bitcoin quotes (BTC/USD) from July 21, 2019, to April 19, 2022, MetaTrader 5 trading terminal, W1 candles. Date of access: April 19, 2022
The chart above indicates the Bitcoin exchange rate is an example of using Fibonacci levels. The blue line shows the levels of the growth of bitcoin from the end of 2020 to April 2021. Green – from June to November 2021. The blue line quite effectively predicted the depth of the correction: the level of 38.2% at the price of $27,000, into which the BTC/USD price later dropped.
Why is Bitcoin predicted to be worth $100,000?
On the one hand, this is a round number – markets love round levels. On the other hand, $100,000 is near the 150% and 161.8% levels of the blue line. The intersection of the blue level of 150% and the green level of 161.8%, shows us more precise price of $94,000 (shown by green arrows). For this analysis, it is a more accurate target level than the $100,000 value.
Why is the use of Fibonacci tools relevant today? Because most cryptocurrencies do not have a long trading history. Traders need rough guidelines for calculating the profit/risk ratio and forming trading strategies. That is why many of them use the Fibonacci ruler.
Cryptocurrency Trading Platforms
A cryptocurrency trading platform is a unique program that allows the user to open, modify, and close transactions to purchase and sell crypto-currency within special instruments. For example, to open a trade on Litecoin (LTC/USD), you need to open an account and connect to the trading platform. Next, you need to select the desired cryptocurrency in this platform, analyze the quotes chart, and decide on the deal.
Platforms are different: universal and highly specialized. The latter is created based on specific brokers and exchanges and has a narrowly focused functionality of work within the framework of the presented trading instruments. The first ones allow you to work with almost any asset, regardless of the exchange and broker.
It is much easier to get acquainted with the platform once and use it in various markets than to constantly “relearn”: memorize the functionality of new platforms and get used to their interfaces. One such universal platform is MetaTrader 5, one of the most widely used trading terminals in the world.
Use the benefits of MetaTrader 5 to earn money:
- market and pending orders of six types;
- extended Depth of Market;
- possibility of hedging open positions;
- free indicators and trading advisors;
- built-in economic calendar and market news update in real-time;
- trading in a mobile application and browser.
Try all the features of MetaTrader 5 for cryptocurrency trading on an AMarkets demo account! You will receive $10,000 in virtual funds and access to live quotes. Test strategies and trading ideas without risk!
Effective Cryptocurrency Trading Strategies
Despite the fact that earnings in the framework of cryptocurrency instruments are possible both with the growth of quotations and their decline, the essence of cryptocurrency trading is to find assets with high growth potential in the near future. In this sense, investing in cryptocurrencies is similar to investing in stocks. Let’s consider two strategies.
Strategy #1. Profitable following bitcoin
From July to October 2021, the bitcoin price increased by 135%. During the same period, the Polka Dot (DOT/USD) cryptocurrency showed an increase of 440%. In the following months, both assets returned to their July values. This example indicates that if the value of BTC/USD rises by 160% to $100,000 as early as 2022, then DOT/USD could rise by about 550% to $115.00 over the same period.
Note that these cryptocurrencies have different nominal values. In other words, for $1000, you can buy about 0.026 BTC and as much as 57.6 DOT at the exchange rate on 04/25/2022 – 2215 times more.
Other cryptocurrencies can give a similar “increased” profitability. For example, Solana (SOL/USD) and Dashcoin (DSH/USD).
Strategy #2. Trading of chart patterns
Cryptocurrencies are relatively young trading instruments by the standards of the existence of financial markets. Their trading ranges are not yet fully formed. Therefore, traders and investors need some guidance for opening and closing positions. Many use classic chart patterns and technical indicators to trade cryptocurrencies.
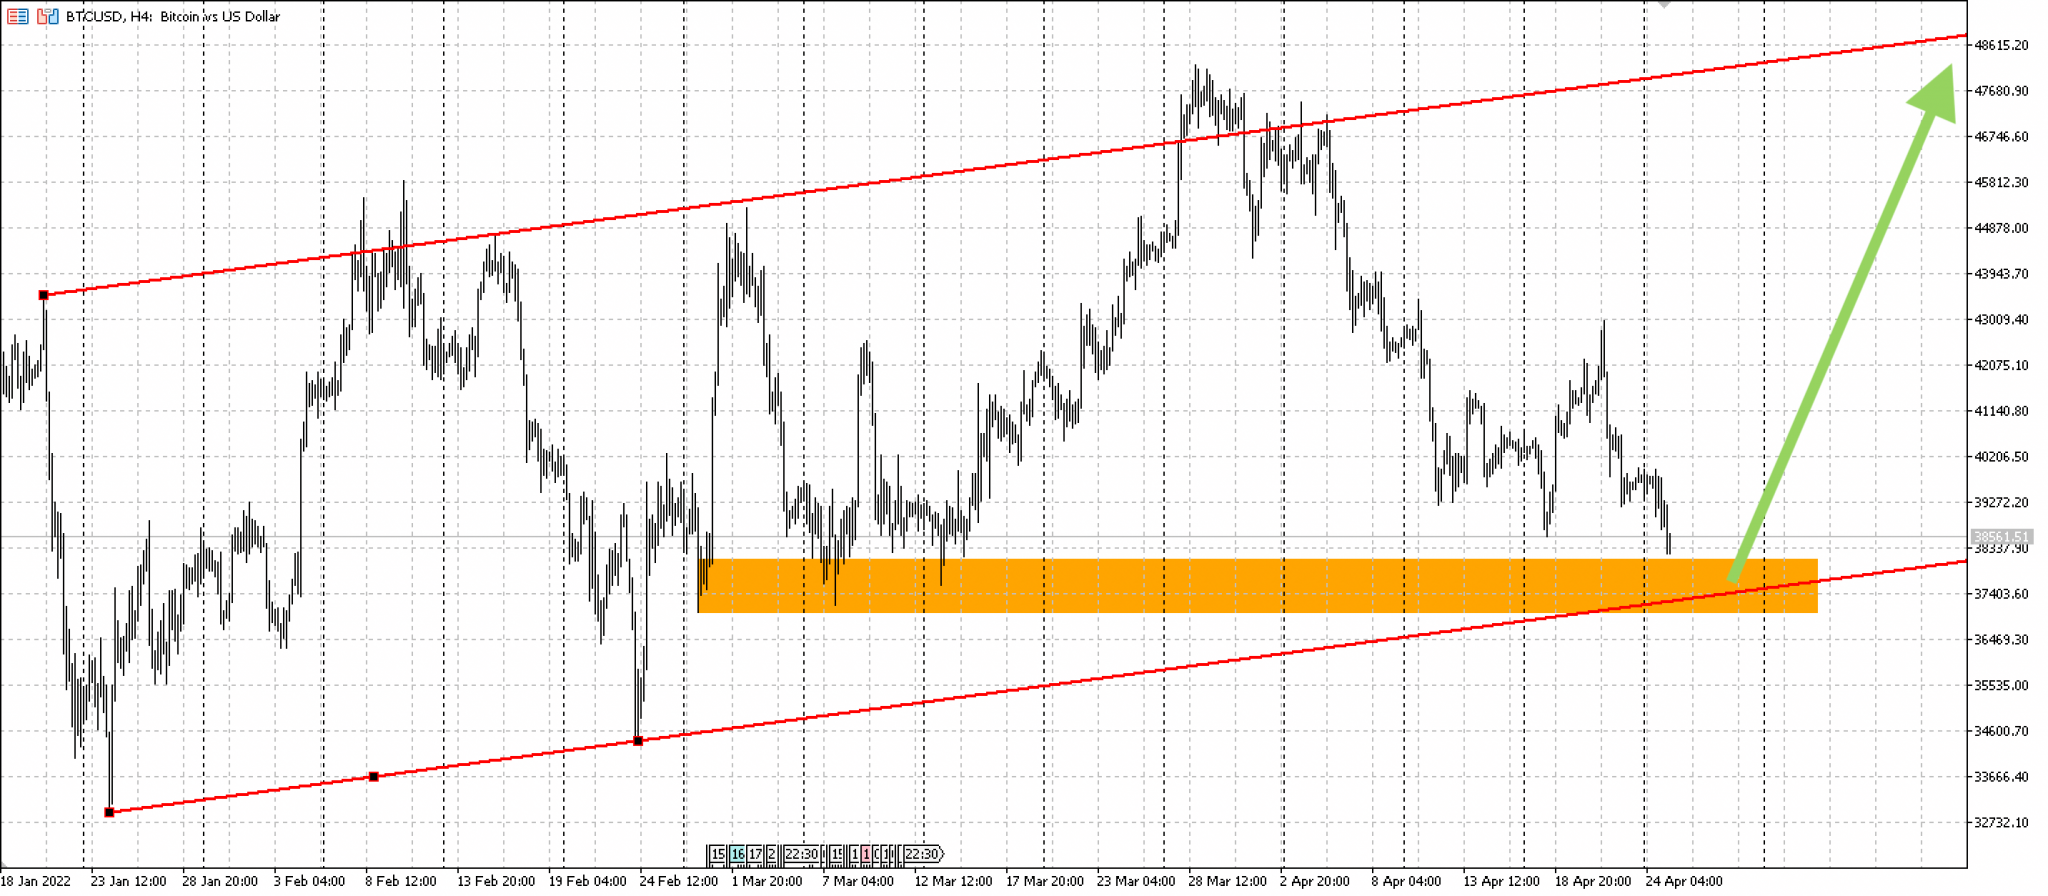
The dynamics of bitcoin quotes (BTC/USD) from January 18, 2022, to April 25, 2022, MetaTrader 5 trading terminal, H4 candles. Date of access: April 25, 2022
The figure above shows the dynamics of the cost of one bitcoin in US dollars. The red lines illustrate the price channel. The BTC/USD rate has been moving for the last three months, rebounding quite confidently from the boundaries: more than 95% of the quotes are inside the channel. The orange line characterizes the local support level formed earlier due to price accumulation: $37,000–$38,100. If the quotes continue to move in the given range, then we can expect a rebound from this support level with targets of $48,000 and above.
This analysis clearly shows how easily and successfully cryptocurrency quotes “work out” even simple graphic patterns. The world of cryptocurrencies is so wide that no one can call himself a fully formed professional of the entire industry. Everyone will find new directions for development. Moreover, new cryptocurrencies appear pretty often.
Thanks to this, every novice crypto trader who has begun to develop today can soon become a professional in a narrow niche and earn steadily.
 In today’s fast-paced financial world, responsible trading is no longer a choice; it's a necessity. Technology has opened the markets to everyone, making access incredibly easy.
 For active traders and investors, mastering the art of trading volatility is a crucial skill. Volatility, in financial terms, refers to the extent to which asset prices fluctuate over time. High volatility markets experience rapid price swings...
 The global financial market operates as a dynamic ecosystem, where understanding the connections between different market movements can provide invaluable insights for forecasting...
 The forex market, also known as the foreign exchange market, stands as the largest and most traded financial market globally. FXTM is committed to equipping our clients...
 Cryptocurrency trading has rapidly grown into a bustling and dynamic market that attracts traders from around the world. With the potential for significant profits...