Whether you're a beginner or a more experienced trader, you need to be comfortable with technical analysis in order to make better trading decisions. To be able to predict how a currency pair's price will move in the future, you must have some means to analyse its historical and current price behaviour. Thus, every trader using technical analysis needs to learn how to read price charts.
Keep reading the article below to get the basics on 3 popular Forex Charts so you can feel more confident in the markets.
What are Forex Charts?
Simply put, a chart is a visual representation of how a currency pair's price changes over time. Price charts are a reflection of supply and demand, including the effects of economic events and future price predictions made by traders. Every time a chart is updated, it shows every buy and sell transaction that took place for that financial instrument (in this case, currency pairs).
3 Popular Types of Price Charts
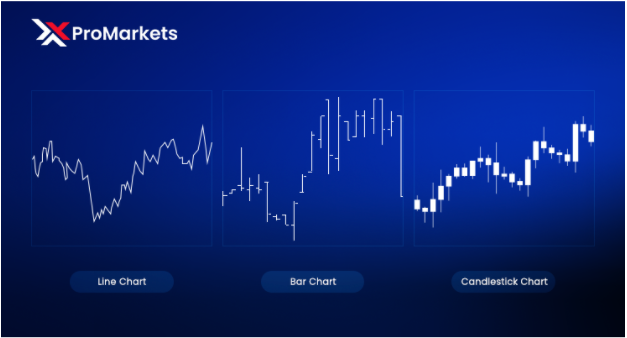
Let’s take a look at 3 of the most frequently used types of price charts.
Line chart
In a simple line chart, one line connects one closing price with the next closing price. The price movement of a currency pair can be observed when it is strung together with a line over time. However, this means that the only information you actually have is what the closing price was. Nevertheless, it allows traders to visualise trends and compare closing prices across periods more easily. It is easy to determine trends through a line chart since it is simply the slope of the line.
Bar chart
This type of chart is a little more complex. This chart shows both the opening and closing prices, as well as the highs and lows. In this way, it can help traders determine the price range of each period. It’s important to know that the bottom of the vertical bar depicts the lowest traded price for that time period and the top of the bar reflects the highest price. Thus, the vertical bar represents the currency pair’s trading range. To make things even more clear, the bars become larger when price fluctuations are highly volatile and smaller when fluctuations are more subdued.
You should also keep in mind that the horizontal lines attached to the price bar record the period's opening and closing prices. The horizontal hash on the left side of the bar indicates the opening price, and the horizontal hash on the right side indicates the closing price.
Candlestick chart
In simple words, candlestick charts show the same price information as a bar chart but in a more visual and direct manner. Although there is still a vertical line indicating highs and lows, the larger block in the middle indicates the range between opening and closing prices. By displaying different colours on the body, candlesticks illustrate bullish or bearish sentiment. The currency pair closes lower than it opened if the middle block is filled in or colored in. A closing price that is higher than the opening price will result in the middle block appearing "white" or hollow.
Which Forex Chart is the Best to Use?
Due to the various types of charts available and the different trading styles that exist, we cannot really say that one chart is better than the other. Each trader is different when it comes to strategy preferences and skills. Moreover, please remember that each chart will have its own advantages and disadvantages. While you may choose to use a specific type of forex chart or use multiple, it all depends on your likings.
If you’re still not sure which chart is the best one for you, log in to your account to get more information through XPro Markets’ educational resources.
 In today’s fast-paced financial world, responsible trading is no longer a choice; it's a necessity. Technology has opened the markets to everyone, making access incredibly easy.
 For active traders and investors, mastering the art of trading volatility is a crucial skill. Volatility, in financial terms, refers to the extent to which asset prices fluctuate over time. High volatility markets experience rapid price swings...
 The global financial market operates as a dynamic ecosystem, where understanding the connections between different market movements can provide invaluable insights for forecasting...
 The forex market, also known as the foreign exchange market, stands as the largest and most traded financial market globally. FXTM is committed to equipping our clients...
 Cryptocurrency trading has rapidly grown into a bustling and dynamic market that attracts traders from around the world. With the potential for significant profits...