In essence, technical analysis hinges on the study of past price movements and trends to predict future market developments. It first emerged as a tradition in 19th century Japan, where rice merchants used candlestick charts to anticipate price changes in their staple commodity. Fast forward to the present day, and it has become a must-have tool in the arsenal of virtually every serious day trader and even some long-term investors.
Since its humble beginnings, technical analysis has developed significantly as a field and now comprises a variety of oscillators, patterns, trend indicators and more.
What is technical analysis?
Proponents of technical analysis say it is the only research tool one needs to succeed as a trader or investor since the market 'prices in' all relevant fundamental news and developments anyway. Whatever your position on the debate, there's no denying that technical analysis is an extremely useful string to one's bow, especially when searching for entry and exit points. Today, we're going to look at some of the most popular in-chart indicators available on the Libertex platform and how to use them to your advantage!
Relative Strength Index
Let's start with perhaps the quintessential indicator for selecting when to open or close a position: the Relative Strength Index or RSI for short. This is a momentum indicator that shows whether a market is overbought or oversold at any given moment. J. Welles Wilder Jr's seminal indicator is displayed as an oscillator (a line graph that moves between two extremes), and its potential values range from 0 to 100. It's generally understood that any value below about 30 suggests that the market is oversold and a rise to the upside is close at hand.
On the contrary, a reading above 70 typically indicates an overbought market, which would mean that a sell-off could be on the cards. To overlay the RSI on a chart in the Libertex platform, all you need to do is follow these simple steps:
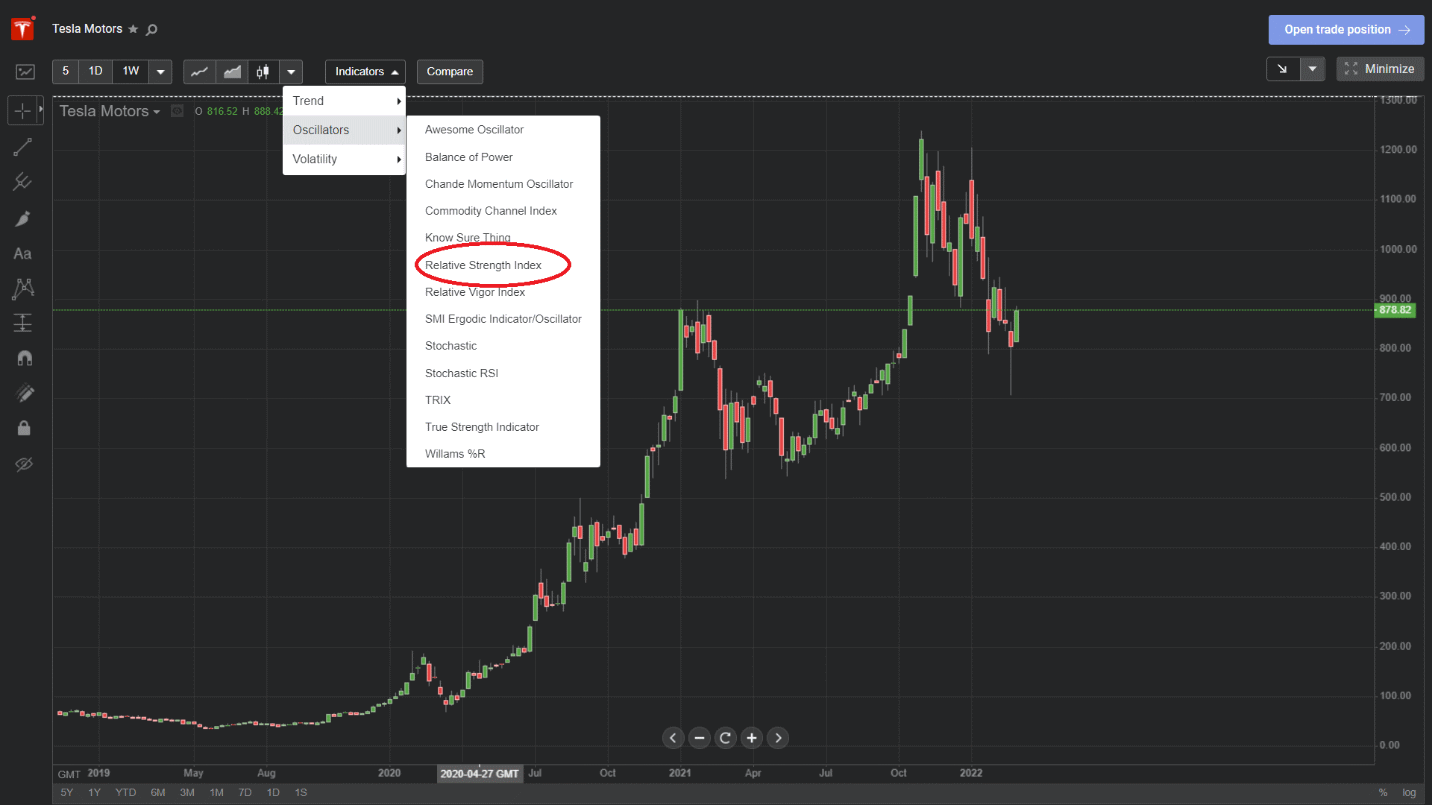
First, enter full-screen mode on your chosen chart, then hover over the indicators tab as shown. After that, a dropdown menu should appear. Hover over the 'Oscillators' tab and then select 'Relative Strength Index' from the dropdown menu.
Once that's done, the RSI will appear at the bottom of the chart as shown below:
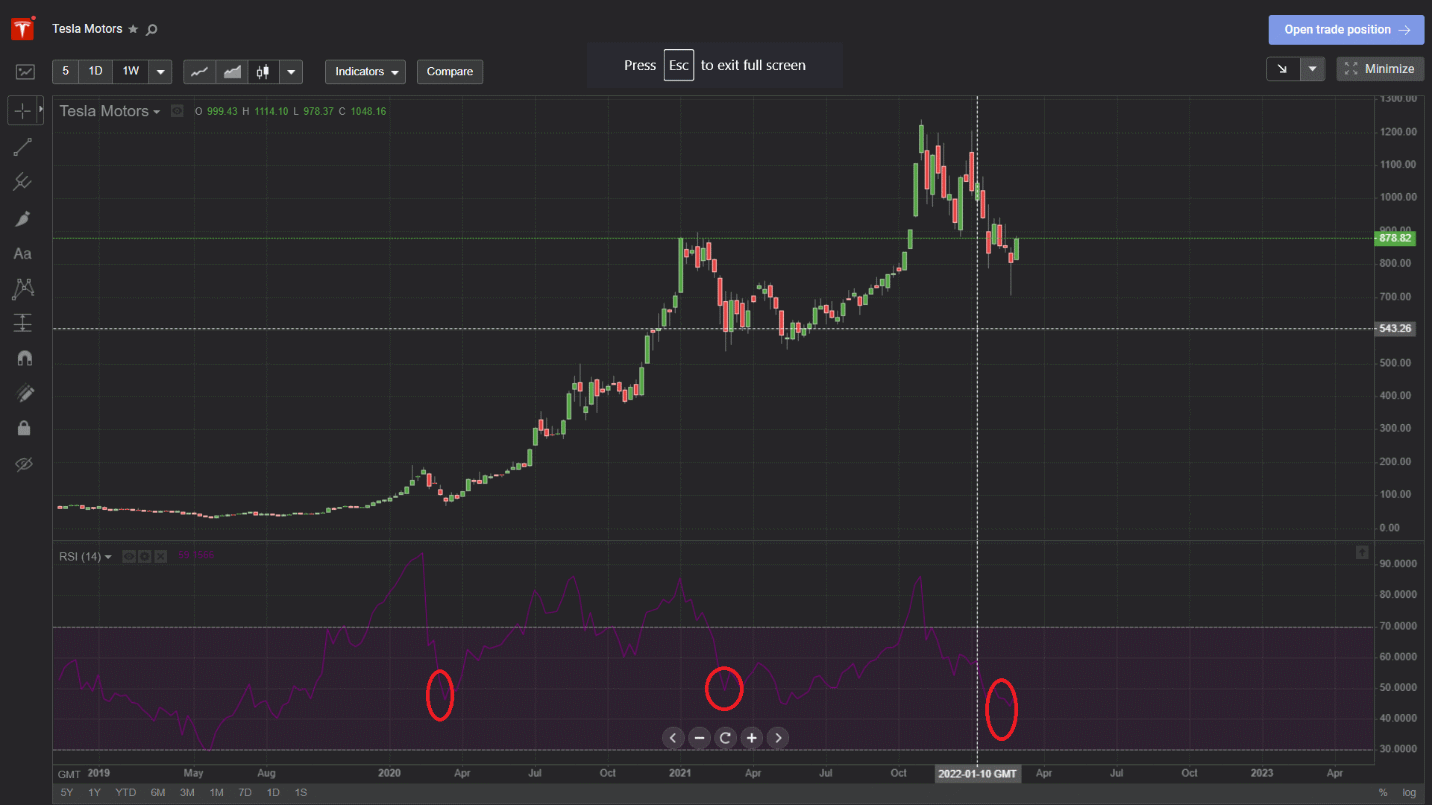
If we look at the first two red circles, we see that these low points on the RSI immediately precede significant moves to the upside. The last one marks where we stand currently, which would suggest that we are at or close to a local bottom.
Moving Average Convergence Divergence (MACD)
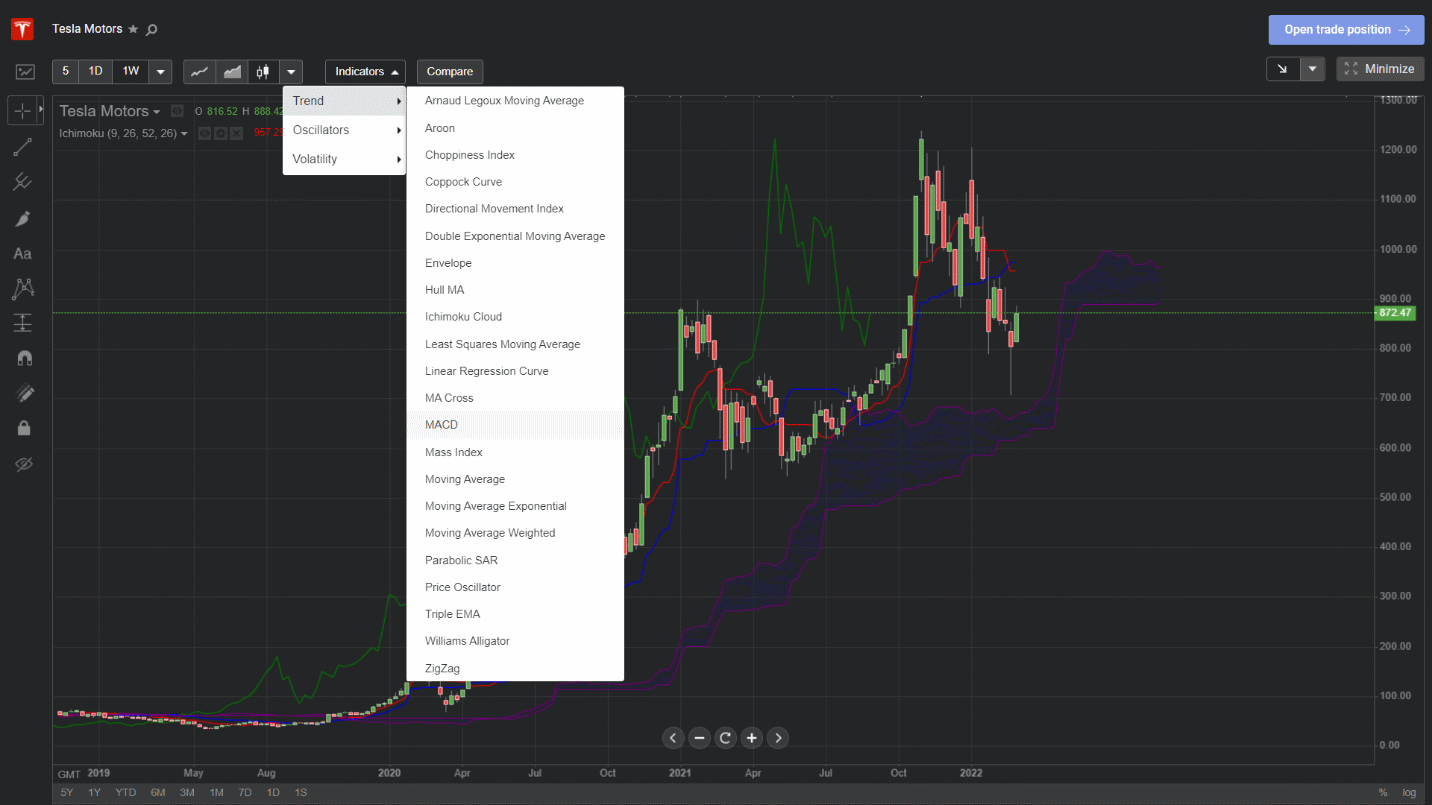
The MACD indicator is used to determine trend direction and, to a lesser extent, momentum. Beyond this, it can also provide a variety of different trade signals. Generally speaking, a security's price can be said to be in an upward phase any time the MACD is above zero. If the MACD is below zero, however, the instrument is considered to be in a bearish trend. Here's how to open it on the Libertex platform:
The indicator itself consists of two lines: the MACD line and the signal line, which moves more slowly. Should the MACD crosses below the signal line, this would indicate a falling price. If the MACD line crosses above the signal line, though, this means the price is on the rise. While the MACD can be used to pick entry points in the same way as the RSI, its consideration of actual price as opposed to just buying and selling means that it can be used in conjunction with other indicators like the RSI to assess whether a given trend is likely to continue or not.
To see an example of this in action, let's see that same TSLA chart again with the MACD overlaid below:
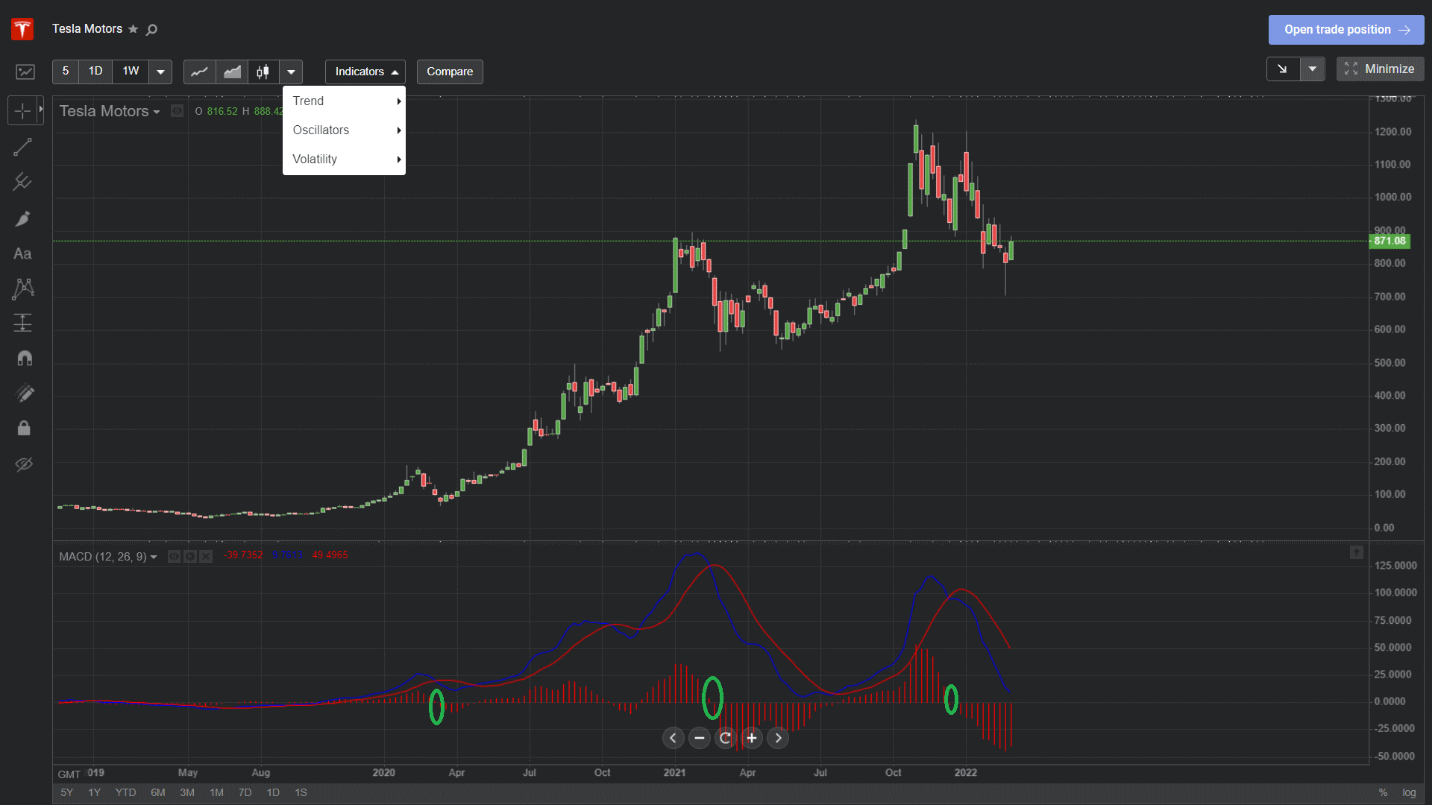
Look closely at the green circles. These represent points where the MACD and signal line cross. Notice how a significant move to the downside follows each crossover? Sometimes the downtrend has already begun, but picking up on the trend reversal early and closing out any long positions/opening short positions upon crossover would have undoubtedly saved/made you a decent amount of money.
Learn with Libertex
This was the first in a series of technical analysis guides that will help you make the most of the Libertex app's in-chart technical analysis tools. Tune in for a closer look at two more key indicators that all successful traders know and use to their advantage. In the meantime, try out some of these new techniques on your Libertex demo account and see for yourself how useful they can be in anticipating price movements.
 In today’s fast-paced financial world, responsible trading is no longer a choice; it's a necessity. Technology has opened the markets to everyone, making access incredibly easy.
 For active traders and investors, mastering the art of trading volatility is a crucial skill. Volatility, in financial terms, refers to the extent to which asset prices fluctuate over time. High volatility markets experience rapid price swings...
 The global financial market operates as a dynamic ecosystem, where understanding the connections between different market movements can provide invaluable insights for forecasting...
 The forex market, also known as the foreign exchange market, stands as the largest and most traded financial market globally. FXTM is committed to equipping our clients...
 Cryptocurrency trading has rapidly grown into a bustling and dynamic market that attracts traders from around the world. With the potential for significant profits...