Traders are divided into two major groups, fundamental and technical, based on the types of analysis they use. Fundamental analysis relies on economic data and news, while technical analysis checks for signals using technical indicators. A wide range of indicators provides traders with a vast number of signals. Nevertheless, it's crucial to know what indicator to apply in different market conditions. Here's a comprehensive guide that will help you quickly learn about all of the useful indicators and build a solid trading strategy.
Traders are divided into two major groups, fundamental and technical, based on the types of analysis they use. Fundamental analysis relies on economic data and news, while technical analysis checks for signals using technical indicators.
A wide range of indicators provides traders with a vast number of signals. Nevertheless, it's crucial to know what indicator to apply in different market conditions. Here's a comprehensive guide that will help you quickly learn about all of the useful indicators and build a solid trading strategy.
Technical Indicator: Definition
Before we start, let's define what a technical indicator is. A technical indicator is a set of mathematical calculations that use historical price movements to predict future price direction.
Technical tools are famous among investors because they provide reliable signals about entry and exit points, the direction of the trend and its force. They ease the process of market analysis and help create the potential to make profit. You should know that indicators serve different aims and be aware of when and how to use them.
How Do Forex Indicators Work?
A technical indicator is a tool that calculates previous price movements. It can use prior open, close, high and low prices for a specific period of time to predict the price's future direction. Traders don't have to do any calculations, and the indicator is applied automatically.
Still, to read the indicator's signals, you need to practise a lot. Some technical tools provide several signals, and you should keep them in mind. It may sound complicated, but if you choose the indicators that best suit your trading strategy, you only need three to five of them.
Technical indicators can be used for different securities such as stocks, currencies and commodities.
It's worth mentioning that technical indicators can be used for different securities such as stocks, currencies and commodities. Moreover, most of them work perfectly well for stocks and currencies. Technical indicators have different settings you should know about to use them efficiently. Usually, they differ regarding the timeframe you trade on.
Most of the popular indicators are set by default in trading platforms, for instance, MetaTrader. You can place them on the chart in just several clicks.
Let's consider how to do this using MetaTrader 4. Click the 'Insert' window and choose 'Indicators'. After that, you can choose from trend indicators, oscillators, volumes and Bill William indicators. Each group includes different instruments.
Trading Indicators: Types
There are many types of technical instruments. However, we'd like to highlight three of them. Those are overlays, oscillators and Bill Williams indicators:
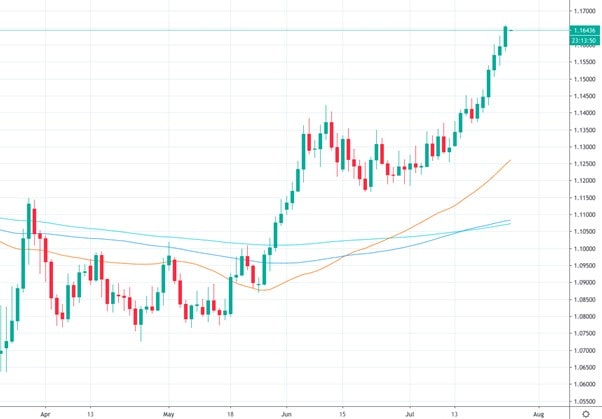
Overlays are applied directly to the chart. So, they interact with the price. Overlays are so-called trend indicators. Thus, you can see the current trend, its force and its direction.
Oscillators are another type of technical tool. The indicators usually appear below the price chart in a separate window. Oscillators provide perfect entry and exit points. However, they can also give signals about the trend direction and its strength.
Bill Williams Indicators. These indicators serve the same aims as the previous ones. For convenience, experts mark a group of indicators developed by Bill Williams, a famous trader who invented his own trading theory and six famous technical instruments. We'll discuss all of them later.
Trend Indicators
Trend indicators or overlays are used to define the direction and force of the current trend. "The trend is your friend." Ever heard this phrase? The trend is one of the most important patterns you should be able to determine on the chart. If you find a trend, you can be sure you'll find useful entry and exit points. There's a wide range of trend indicators, and we'll mention the most effective of them.
Trend indicators are used to define the direction and force of the current trend.
Moving Average
The Moving Average is a leading indicator. It's popular because of its simplicity and effectiveness. It's widely used to build other indicators; you'll notice it if you read the whole list of indicators. Many traders like it because it provides strong signals.
The Moving Average indicator is widely used to build other indicators.
There are four types of moving averages that serve different aims, such as simple, smoothed, exponential and linear weighted. However, all of them have something in common: they use average prices that smooth out market fluctuations.
The indicator consists of one line, but traders usually use two to three lines with different settings to catch a signal. The Moving Average has two main functions: first, it determines the trend direction; second, it serves as a support level.
Bollinger Bands
This indicator has three lines and is based on the Moving Average indicator. It's a perfect measure of market volatility. When lines move apart from each other, market volatility is high. When they're close to each other, the market is consolidating.
Bollinger Bands help you find an entry point if the price rebounds off either the upper or lower band. The middle line can be used as a support level.
Ichimoku Kinko Hyo
It's one of the most complex indicators. Although it sounds complicated, it's not too difficult to read its signals. Ichimoku includes three lines and one cloud. This instrument shows the trend's direction, strength and momentum. Its lines can also be used as support and resistance levels. The Ichimoku indicator submits trade signals to open a long or short trade.
ADX
Unlike other technical instruments, ADXdetermines the strength of the trend but doesn't show its direction. Although it's a trend indicator, it's placed in a separate window below the price chart. The ADX consists of three lines: ADX, +DMI and –DMI and has several levels that are important to define the trend's force.
If the index is below 25, the trend is weak. If it consolidates between 25 and 50, the trend is strong. In the range between 50 and 75, the trend is robust. When ADX rises above 75, the trend is powerful. Besides the trend strength, you can get buy and sell signals with this indicator. When +DMI breaks above –DMI, it's time to buy. If the opposite happens, consider selling the asset.
Parabolic SAR
SAR means Stop and Reverse. This means that this tool can both determine the trend and signal when to close the trade. The indicator interacts with the price chart and is represented by dots, not lines. When dots are placed above the price, the trend is bearish. If dots are located below the price, the trend is bullish. The trend confirmation appears when there are at least three dots. It can also be used as a signal to buy or sell.
Standard Deviation
The indicator is used to measure the strength of volatility. It's placed in a separate window and has only one line. When the line rises significantly, it's a sign of high volatility. On the other hand, when the indicator fluctuations are low, volatility is low.
Oscillators
Oscillators are another big group of technical indicators that mostly helps find entry and exit points. They're momentum instruments whose signals are based on bouncing between specific levels. Let's look at the ones that will provide the most reliable signals.
Oscillators help find entry and exit points.
MACD
The MACD or Moving Average Convergence Divergence is an oscillator calculated on two Exponential Moving Averages. The tool is used to determine trend reversal points that may become the perfect entry and exit point together with the strength of the trend.
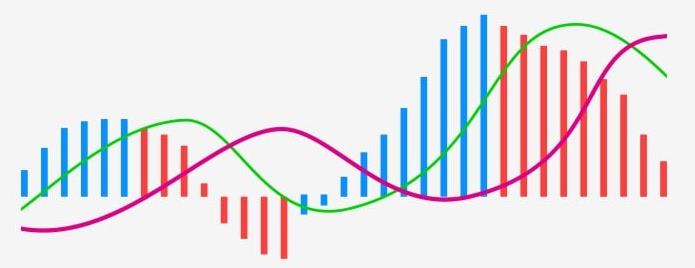
There are four main signals the indicator provides: divergence, overbought/oversold points, the signal line crossover and the zero-line crossover that show the trend's direction. It's one of the most straightforward indicators you can apply to any timeframe.
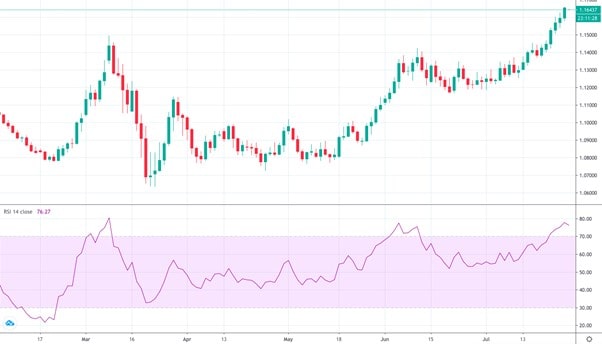
Relative Strength Index (RSI)
This oscillator shows changes in the price movement and signals when the market is overbought and oversold, thus giving perfect entry points. The indicator has two main levels: 30 and 70. When the RSI is above 70, the market is overbought. When it's below 30, the market is oversold. It's also possible to find a divergence between the indicator and the price to determine a trend reversal. The RSI and MACD are often applied together for more trustworthy signals. The standard setting for this indicator is a 14-day period.
Average True Range (ATR)
This oscillator shows how volatile the market is and the average volume of the trading range based on the timeframe. However, the oscillator doesn't show the direction of the trade. It just rises when the volatility is high, and the trend becomes more reliable and falls when volatility isn't significant.
Envelopes
This oscillator is commonly used to define the oversold and overbought market and price targets. It's based on two Moving Averages. Sometimes, envelopes are types of Bollinger Bands. Although the envelope indicator consists of only two lines, they form a channel within which the price moves. You can purchase and sell them according to the price movements within the channel.
Stochastic Oscillator
The stochastic oscillator resembles the RSI. It also shows overbought and oversold market points and a possible trend reversal. It has two levels: 20 and 80. The stochastic oscillator allows you to trade on divergence and has the rules as RSI lines. However, the indicator has two lines that provide additional buy/sell signals. This oscillator can be implemented on any timeframe.
Momentum
In general, momentum reflects the strength of the trend. Although indicators like the MACD, RSI and Stochastic Oscillator are used to gauge the momentum, momentum exists as its own specific indicator that shows the direction of the trend. When it's above 100, the trend is bullish. When it's below 100, the trend is bearish. You can use the indicator with the Moving Average, and the crossover may provide buy/sell signals.
Commodity Channel Index (CCI)
Like most of the indicators, CCI provides entry points, the trend strength and direction and periods of overbought/oversold conditions. It can also be used to find convergence/divergence. When applying the indicator, you should keep in mind the period you choose in your settings. The shorter the period is, the more fluctuated the indicator will be. So, if you need to smooth the market movements, you're better off choosing longer time periods. The most popular settings are 14 and 20.
Relative Vigor Index (RVI)
This is another indicator that gauges trend strength. The RVI is similar to the Stochastic Oscillator and has two main lines. Just as with MACD and RSI, RVI reflects convergence/divergence and overbought/oversold areas. Because there are two lines, their crossover will serve as a signal to buy or sell.
Bill Williams Indicators
The third famous group of symbols is Bill Williams Indicators. Although many traders have invented their own indicators, only Bill Williams' indicators are popular.
Bill Williams Indicators are widely used by traders all around the world.
Acceleration/Deceleration (AD)
This tool is widely used to determine the price change. AD turns around before the price momentum changes. As a result, it can be used to forecast a price reversal. And although it looks the same as the Awesome Oscillator, its signals should be read differently. AD can provide signals related to the market reversal as long as there's an entry point.
Alligator
The alligator indicator is used to define the trend direction. It also helps filter signals leaving the range-bound market and has three lines. Based on other indicators, you can see that the lines' crossover provide buy/sell signals while their direction reflects the trend.
Awesome Oscillator
This tool gauges momentum and predicts price reversals and corrections. The Awesome Oscillator gives bearish and bullish signals and precisely determines the trend direction. That's why you can use it to enter the market and trade on the trend.
Fractals
Fractals are easily found on any price chart. However, to make traders' lives even easier, Bill Williams created this indicator to find entry points and stop-loss levels.
Gator Oscillator
This tool identifies when the market is trending and when it's consolidating. The Gator Oscillator shows periods of market volatility. It works well with the Alligator and almost resembles it.
Market Facilitation Index (MFI)
This tool gauges the strength and weakness of the price movement. The indicator shows the trend strength, so you'll know whether to trade it or not based on the moment when a new trend has chances of starting and when it's best to avoid entering the market.
Tips on How to Use Forex Indicators
Although there are many indicators, we gathered several tips that you can apply to any of them for efficient usage.
- Keep settings in mind. If you use MetaTrader, all of the indicators we mentioned above are automatically set. However, their settings should differ based on the timeframe you trade on. Otherwise, there's a risk of false signals.
- Combine indicators. One indicator is never enough. You're better off with at least three to five tools to check signals. To confirm the signal, we recommend using two to three indicators at once.
- Combine wisely. While we recommend combining indicators, you should do so wisely. Did you notice that some indicators are similar? If they are, don't use them to confirm a signal. Choose ones that serve the same aim but don't resemble each other.
Conclusion
To sum up, there's a wide range of forex indicators that can help you determine a trend and its strength, as well as find the perfect entry/exit points and support/resistance levels. However, you need to practise in order to find the tools that will match your trading strategy. It's better to do it using a free Libertex demo account. The whole range of indicators and real market conditions will help you build a strong strategy.
FAQ
Let's answer the most frequently asked questions about technical indicators.
What Are the Different Types of Forex Indicators?
There are around 20 types of technical indicators. The most famous ones are trend (overlays), oscillators and Bill Williams indicators.
How Many Technical Indicators Are There?
There are hundreds of technical indicators. However, only around 20 of them are the most reliable. All of them are set by default in MetaTrader, so you don't need to download them.
What Are the Leading Technical Indicators?
The MACD, Moving Average, RSI, Awesome Oscillator, Ichimoku Kinko Hyo are considered to be the leading indicators.
How Are Technical Indicators Used?
Technical indicators are applied to the price chart to determine the trend, its strength, buy/sell signals and support/resistance levels.
How Do You Combine Technical Indicators?
You should never combine indicators that resemble each other. Find ones that have the same aim but are based on different calculations.
Are Technical Indicators Useful?
Technical indicators are useful if you implement them correctly. Nevertheless, you should keep in mind the fundamental analysis that provides additional information about market conditions.
 In today’s fast-paced financial world, responsible trading is no longer a choice; it's a necessity. Technology has opened the markets to everyone, making access incredibly easy.
 For active traders and investors, mastering the art of trading volatility is a crucial skill. Volatility, in financial terms, refers to the extent to which asset prices fluctuate over time. High volatility markets experience rapid price swings...
 The global financial market operates as a dynamic ecosystem, where understanding the connections between different market movements can provide invaluable insights for forecasting...
 The forex market, also known as the foreign exchange market, stands as the largest and most traded financial market globally. FXTM is committed to equipping our clients...
 Cryptocurrency trading has rapidly grown into a bustling and dynamic market that attracts traders from around the world. With the potential for significant profits...