The Average Directional Index is often considered the “market strength indicator” and is called the ADX indicator for short. The indicator is one of many created by a pioneer in technical analysis, J. Welles Wilder, who also created the Relative Strength Index, the Parabolic SAR, and many others. The Average Directional Index indicator is a technical analysis tool traders can use to better get a read on the overall market, particularly related to the strength of a trend. The indicator can also be used to signal when trends are weakening, potentially signaling a reversal.
Average Directional Index Definition
The Average Directional Index indicator is sometimes referred to as the Average Directional Movement Index due to the ADX being a combination of two other indicators designed by creator J. Welles Wilder. These additional indicators, the Negative Directional Indicator and the Positive Directional Indicator, signal if the trend is bullish or bearish, providing traders with a signal to buy, sell, short or go long.
Trends are considered strong at readings over 25, and weak under the key level. However, just because a trend is weak doesn’t mean that price doesn’t rise or fall – instead it simply indicates that the market hasn’t chosen a clear direction or is too volatile to properly read.
Why The Average Directional Index Indicator Matters
ADX can signal when markets are trending or ranging. The tool can assist traders in making money more consistently by understanding when to use trend-following trading strategies, or when to focus on range trading strategies in the absence of a trend. The tool is widely used today and considered among the cornerstones of technical analysis, and is among a handful of popular tools in use today that were created by financial analyst wizard and author J. Welles Wilder. Wilder is famous for his book on New Concepts in Technical Trading Systems.
He was considered to be the “premier” technical trader by Forbes Magazine in the early 80s, and earned himself a reputation of developing “more accurate commodity trading systems and concepts than any other expert.” Wilder was an advocate of innate discipline and designed these tools – such as the ADX – to assist traders with sticking to their trading plans.
How the Average Directional Index Indicator Works
- The two indicators that are used to calculate the Average Directional Index are the Negative Directional Indicator and the Positive Directional Indicator, referred to simply as the +DI and -DI.
- The Positive Directional Indicator is used to measure the presence of an uptrend. If +DI is trending pointing upwards, it suggests that an uptrend is increasing in strength.
- The Negative Directional Indicator is used to measure the presence of a downtrend. If -DI is trending pointing downwards, it suggests that a downtrend is increasing in strength.
- The two indicators can be viewed individually but are most commonly found side-by-side on stock charts. When the two lines cross it can provide buy or sell signals for traders.
Both indicators are typically plotted over the ADX indicator, and the two indicators are used to calculate the formula for the ADX itself.
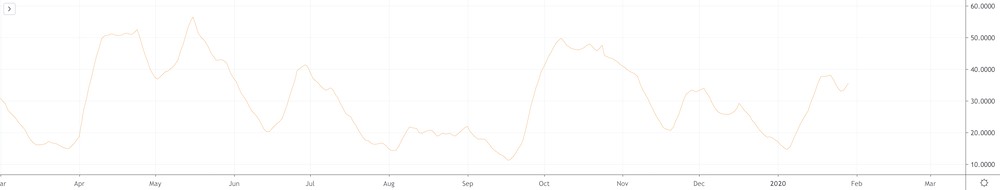
ADX
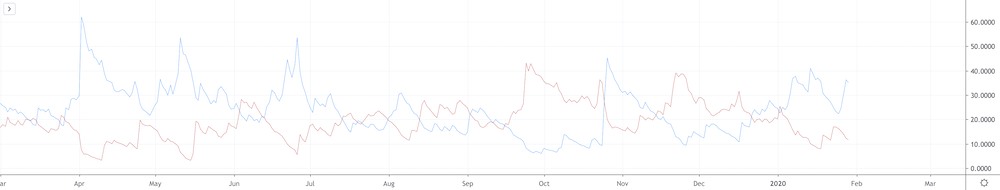
+DI and -DI
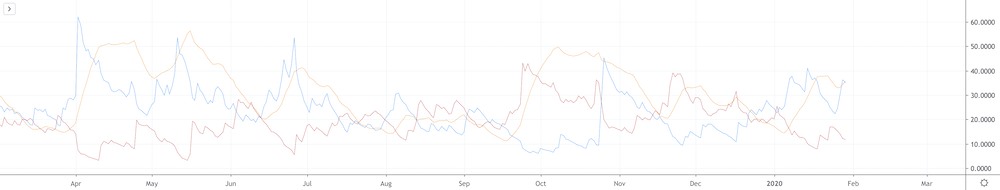
ADX, +DI and -DI Overlay
How the Average Directional Index Indicator is Calculated
The ADX calculation and formula for the Average Directional Index are among the more complicated calculations across all technical analysis indicators, and really demonstrates the tool’s creator’s mathematical ability. It is also more complicated because it first requires calculating the Positive Directional Index and the Negative Directional Index, and before that, directional movement must be calculated to find +DM and -DM.
The formula to find +DM and -DM is: UpMove = today's high − yesterday's high DownMove = yesterday's low − today's low if UpMove > DownMove and UpMove > 0, then +DM = UpMove, else +DM = 0 if DownMove > UpMove and DownMove > 0, then -DM = DownMove, else -DM = 0
The number of periods must next be selected, but is commonly set to the default of 14 periods. Traders can change the settings on the indicator to suit their unique needs.
To find +DI and -DI, the calculation is as follows: +DI = 100 times the smoothed moving average of (+DM) divided by average true range -DI = 100 times the smoothed moving average of (-DM) divided by average true range
Finally, the smoothed moving average is calculated over the number of periods selected – at 14 – and the average true range is a smoothed average of the true ranges.
The remaining calculation to find the ADX formula is: ADX = 100 times the smoothed moving average of the absolute value of (+DI − -DI) divided by (+DI + -DI)
How to Read the Average Directional Index Indicator
Once you understand what is ADX indicator and what it does, the tool becomes relatively easy to read. The indicator consists of the ADX which gauges trend strength, while two additional lines are plotted over the ADX side-by-side, providing further signals on if an asset is a buy or a sell, or when to close a position.
Combined the ADX and the two directional movement indicators can not only help signal when trend changes flip from bearish to bullish but can also help to measure the strength of the trend.
How to Use the Average Directional Index Indicator
Using the Average Directional Index can be a fast way to profit, but first, you must understand how to use it to your advantage. Readings of below 20 or 25 on the ADX, depending on a trader’s personal risk appetite, are considered a weak trend or absence of a trend, while readings above this suggests a trend is growing in strength. Readings up to 75 only show an increase in trend strength, while readings over 75 often tell a trader to stay out of position, as the trend is so strong, it’s bound to be close to running out and reversing, likely resulting in a powerful retracement.
Meanwhile, each individual Directional Index can also be used to signal if a trend is growing or waning in strength, and can even be used to generate buy or sell signals depending on if the lines cross over one another.
The Best Average Directional Index Trading Strategies
The Average Directional Index can be found in many top trader’s arsenals, generating large amounts of profit for those that put it to regular use. While there are dozens of ways to use the tool, here are the best and most accurate Average Directional Index trading strategies that have been proven effective and profitable for many years of market analysis.
Buy Signal When Uptrend Is Confirmed on ADX
When an asset shows a reading of over 25 on the ADX indicator, it signals that a trend is strong and is likely to continue. In the below example, after the ADX breached above 25, a buy signal was issued that led to sizable profits when the uptrend continued during the following weeks.
Sell Signal Followed By Continuation Confirmation As Trend Strength Increases
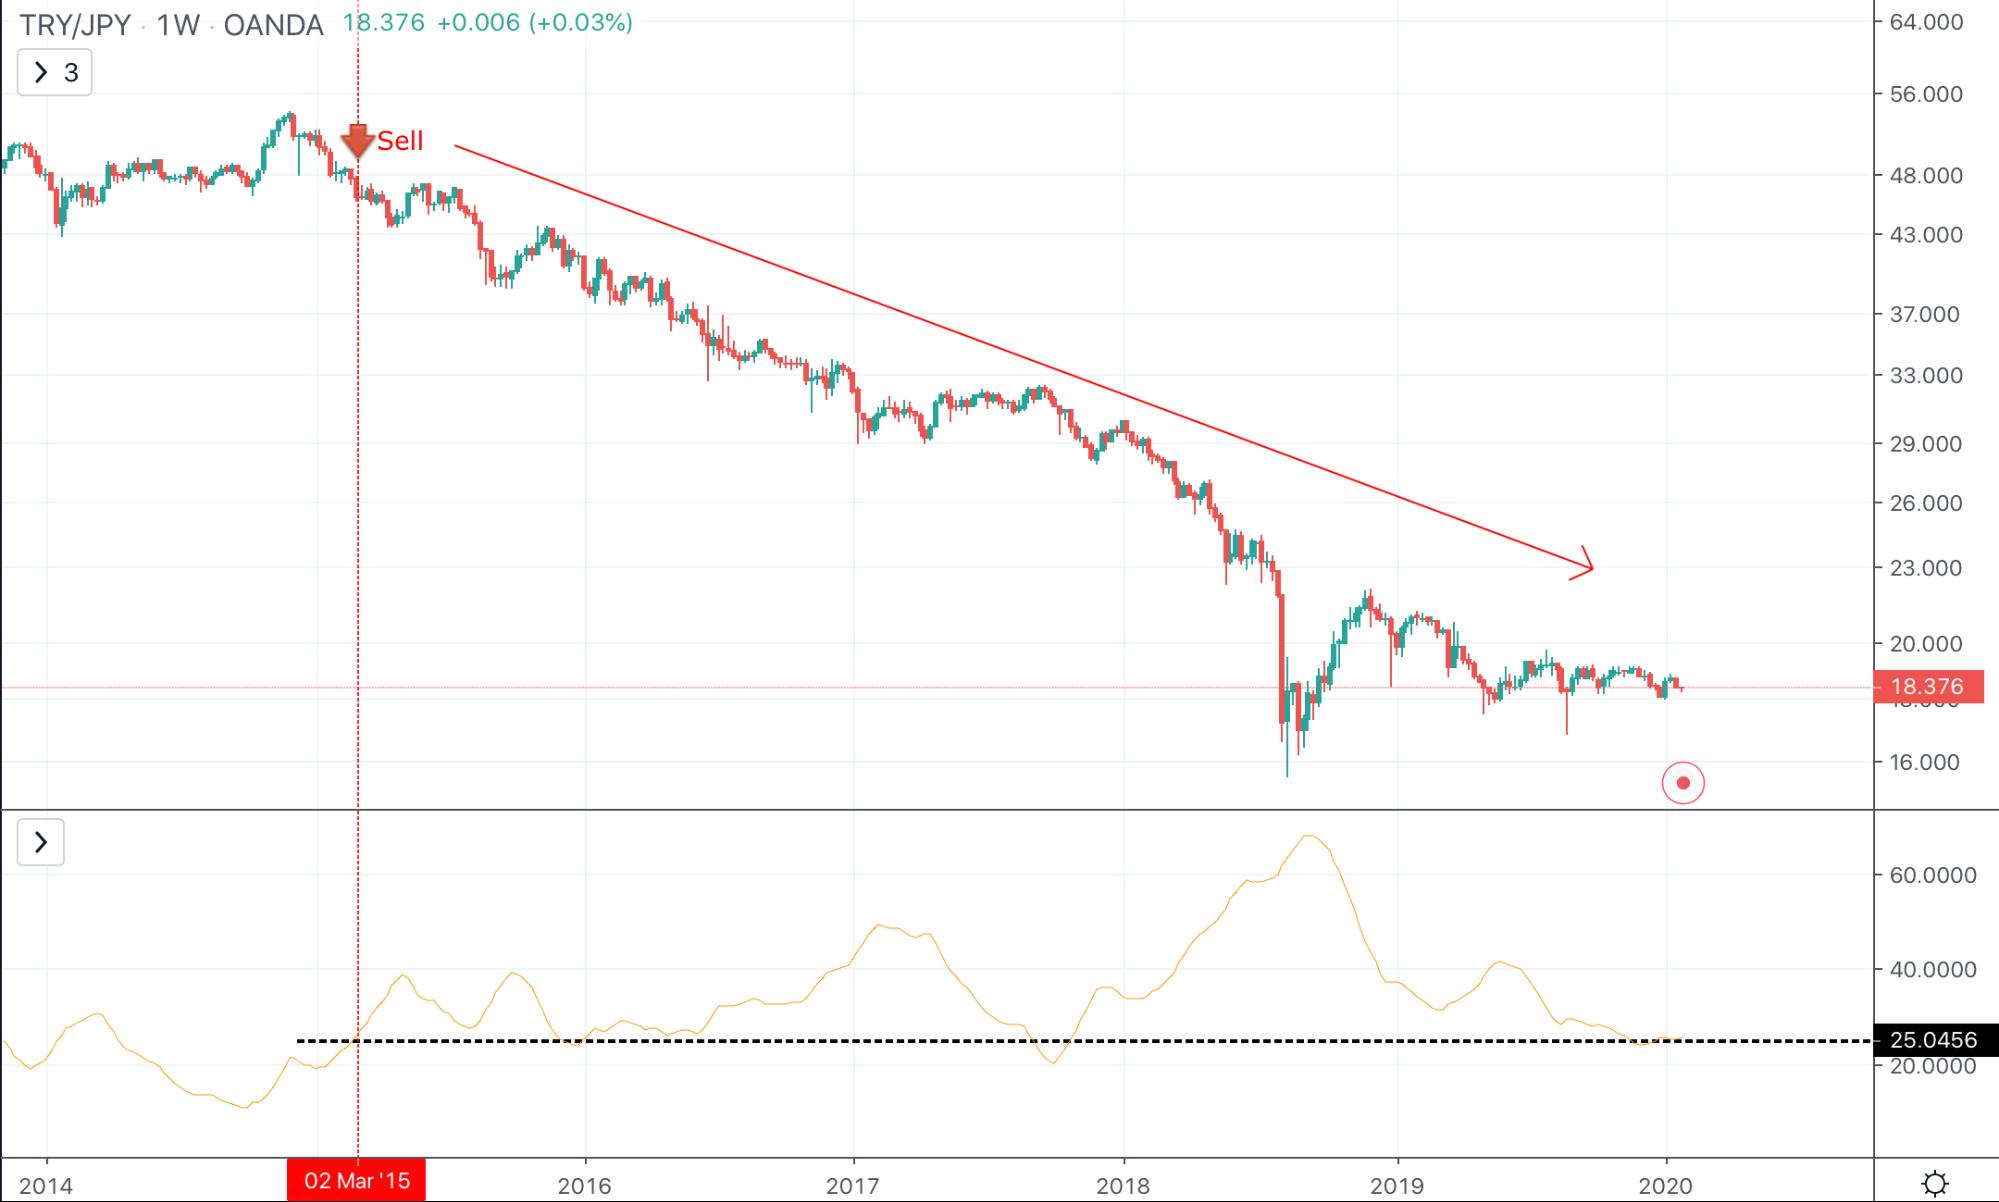
The same is true as above but for sell signals instead. If a downtrending market breaks above 25 on the ADX, a signal is issued. In the example below, TRY is seen falling into a deep downtrend against JPY, as indicated by the ADX going above 25. The trend only continued to increase in strength from there, resulting in a massive decline.
Sell Signal With Directional Index Crossover
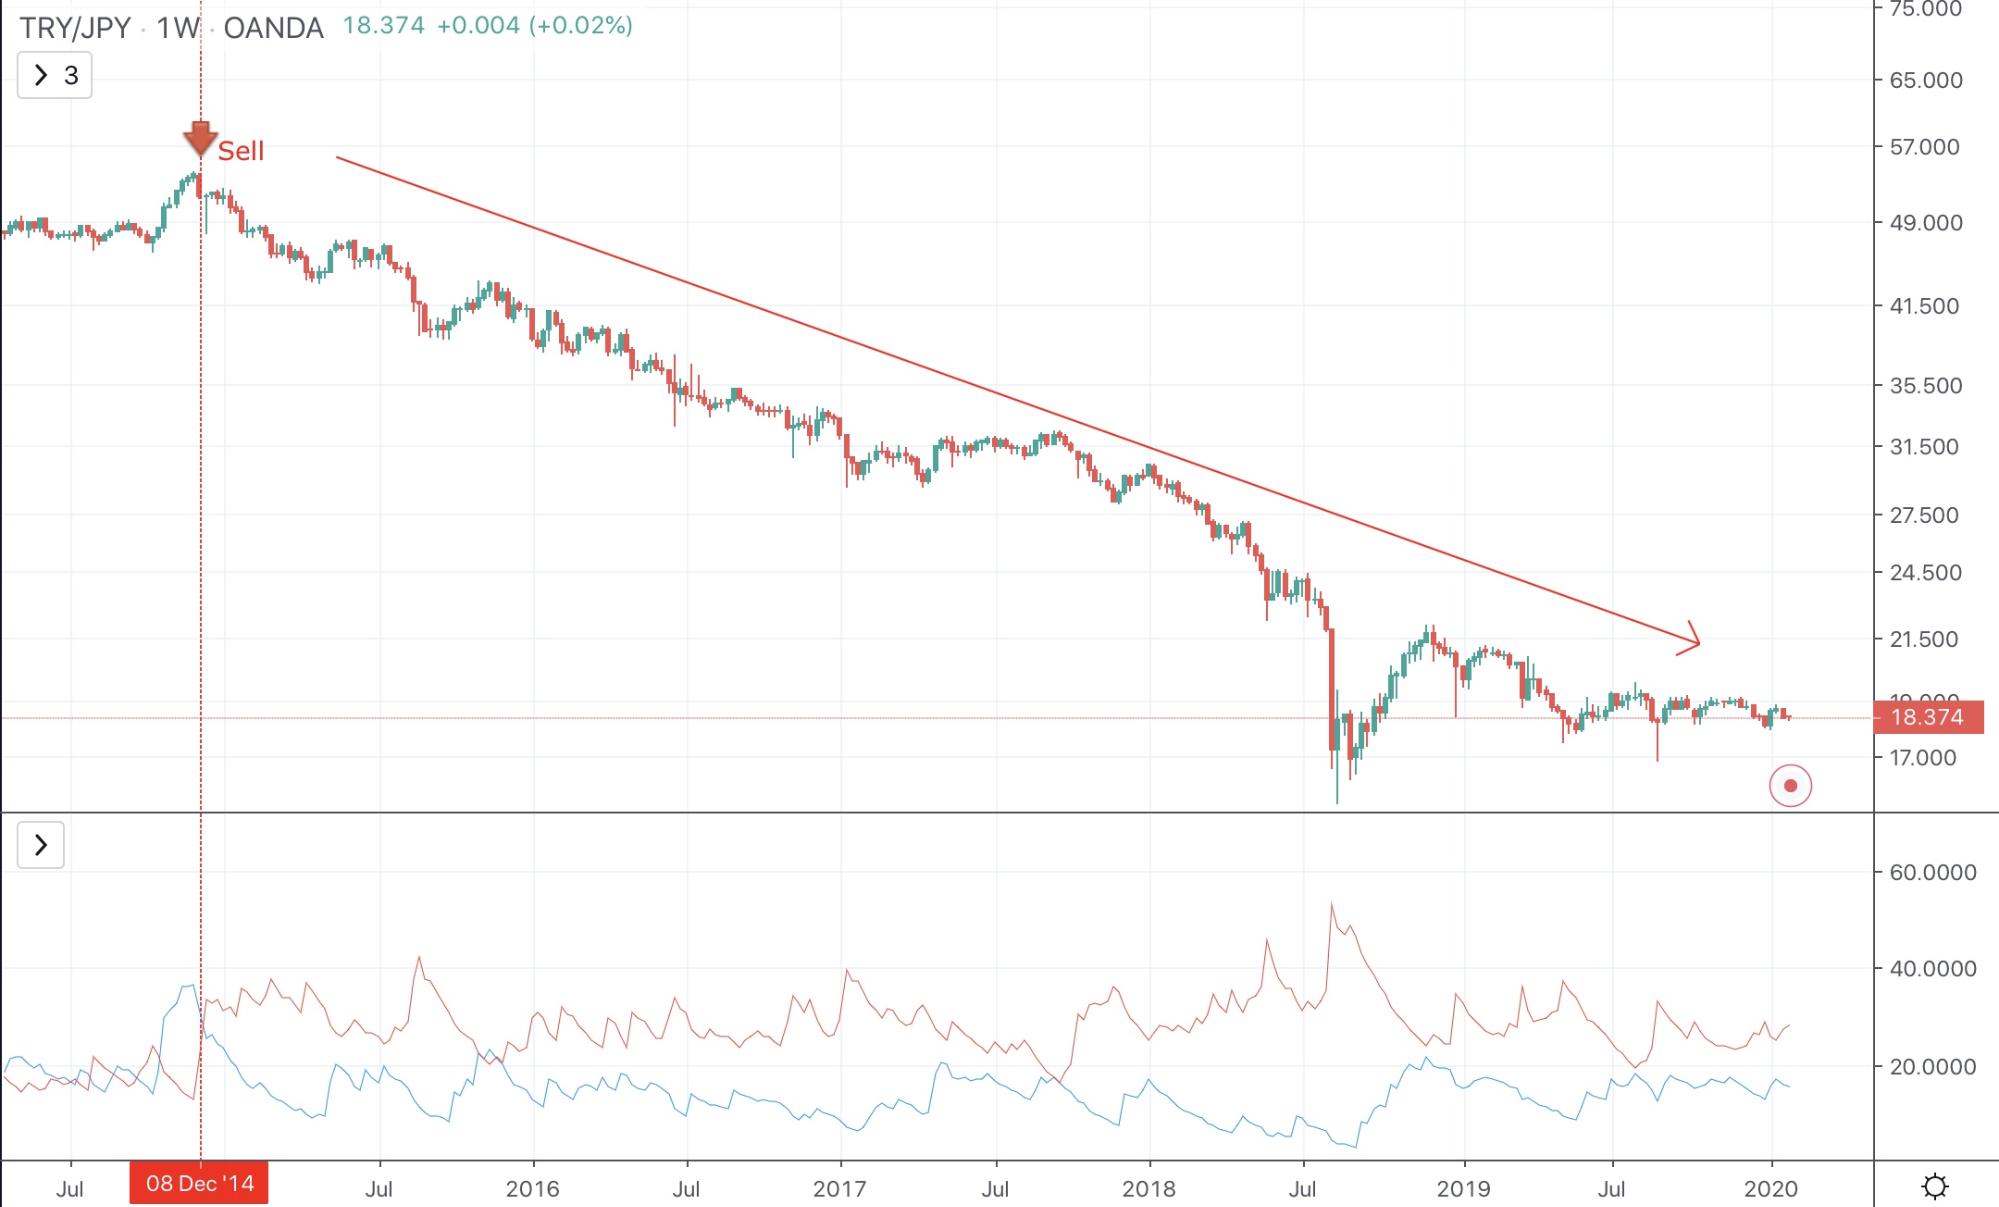
Because the Average Directional Index is comprised of the ADX and two directional indexes, more than one method can be used to trade the same chart. Using the same TRY/JPY example as above, but removing the ADX and instead only focusing on the two Directional Indexes, an earlier sell signal is provided when the two lines cross over one another – long before the candles begin to react and price begins to decline.
Long Strong Uptrends When +DI and ADX Push Upwards
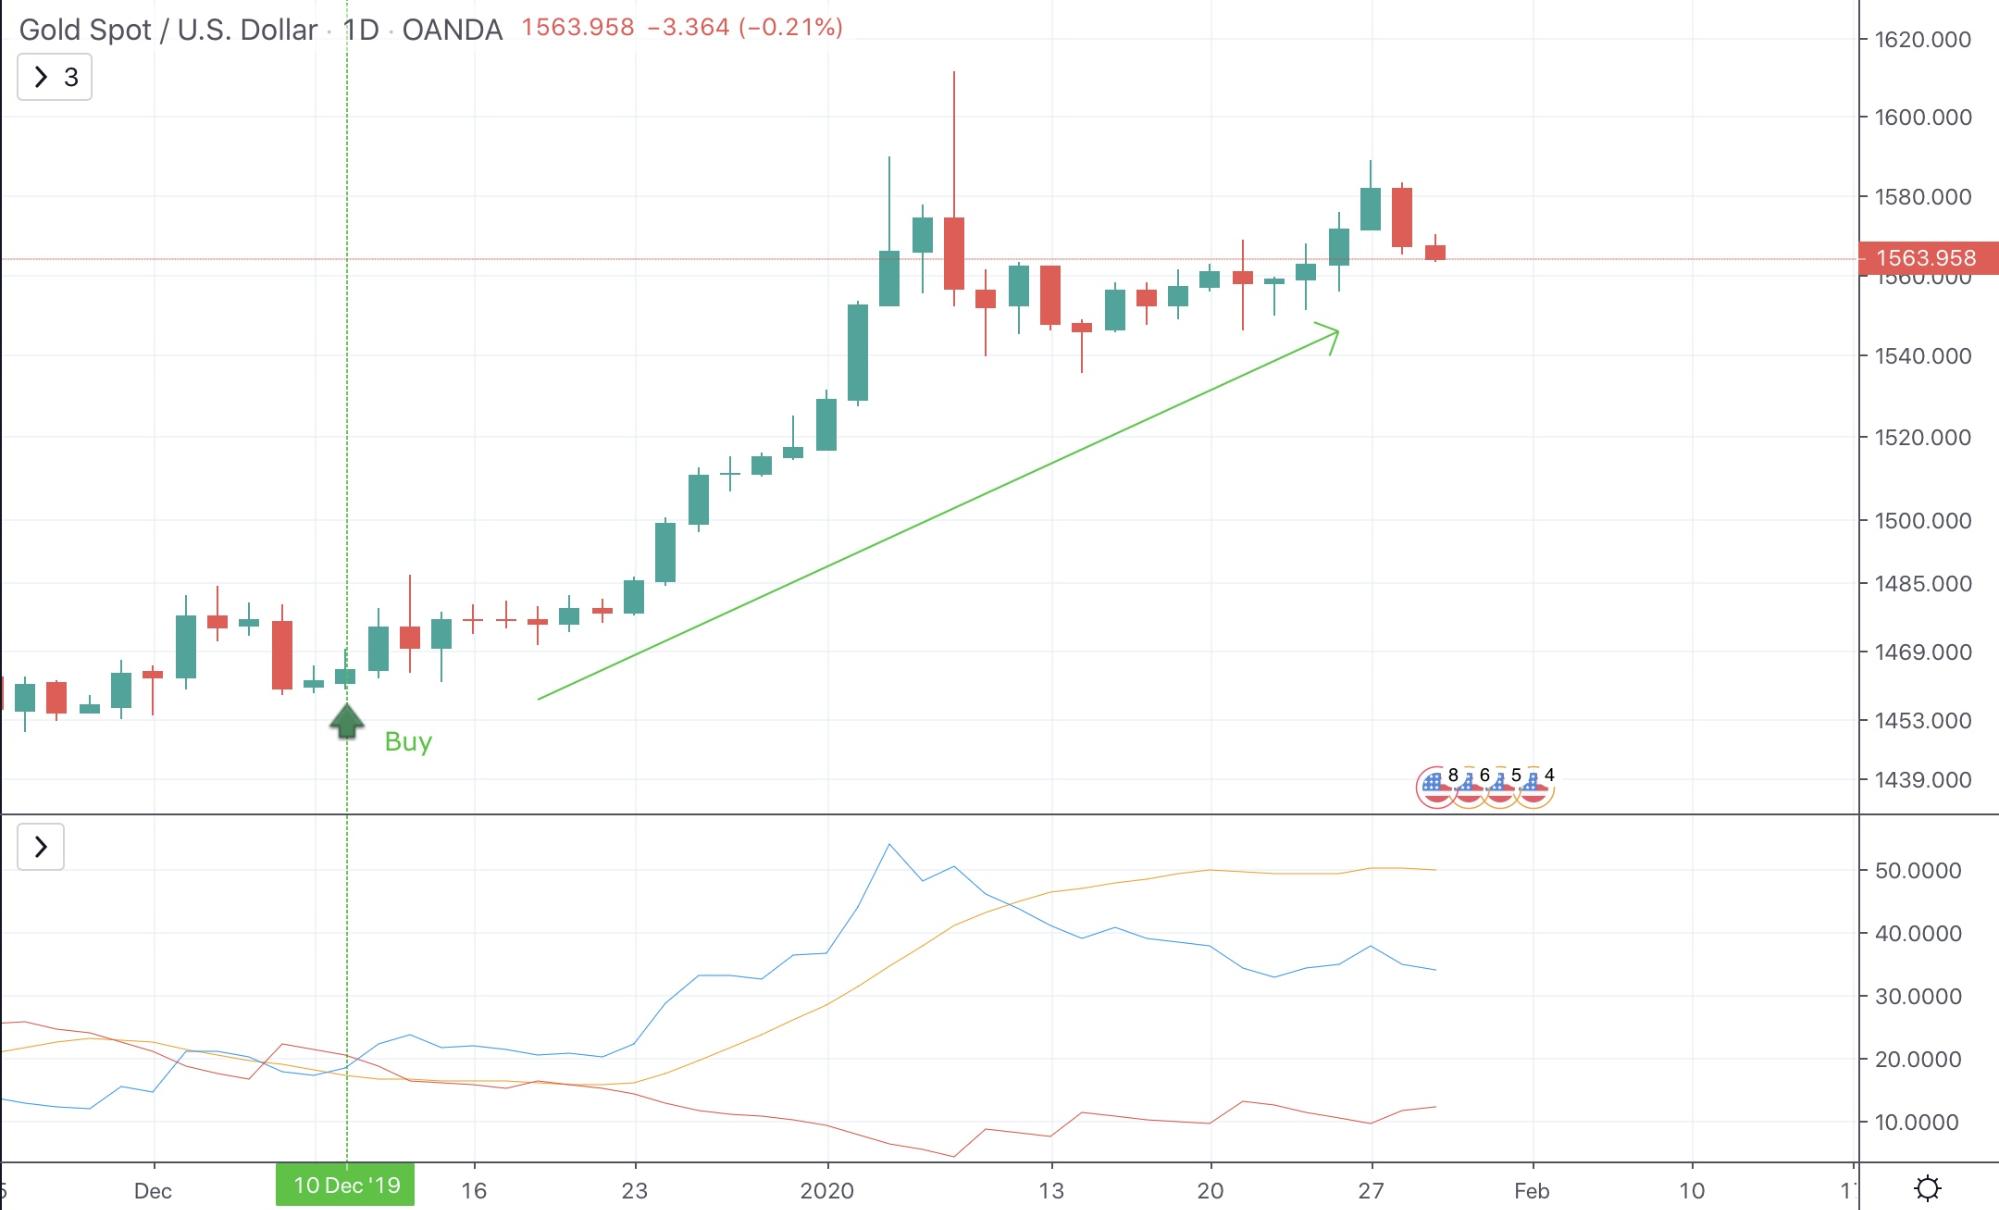
We now understand that crossovers of the +DI and -DI trigger buy or sell signals. But as the +DI rises or -DI falls, it also signals that a trend is picking up strength. Combined with the ADX rising above 25 can lead to especially strong buy signals when the two lines crossover and widen. In the below example, gold can be seen in an extremely powerful uptrend that was first signaled by a crossover in the two Directional Indexes and is later confirmed by both the +DI rising alongside the ADX spiking.
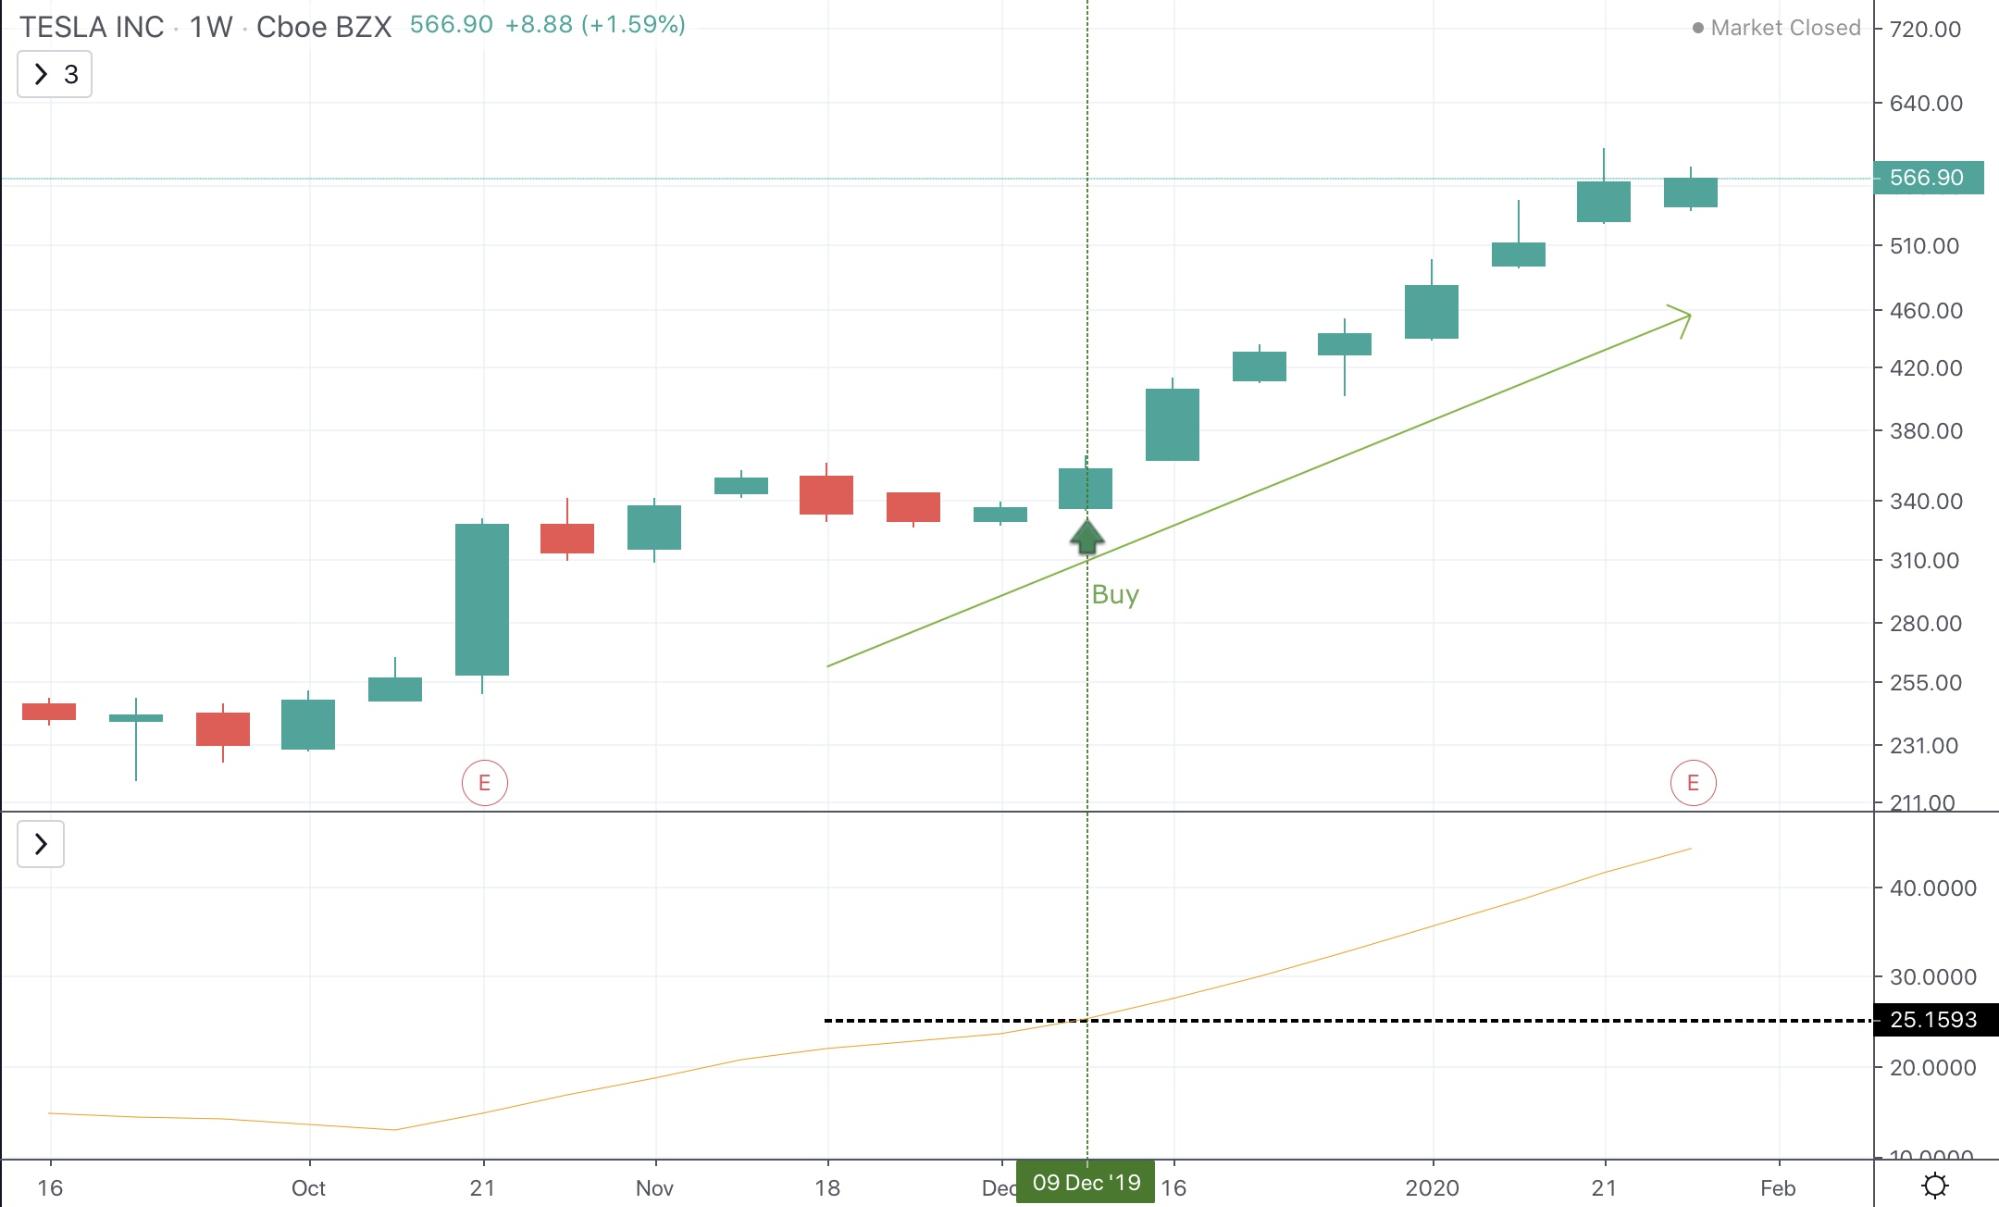
Discover No Trade Zones When Markets Are Ranging
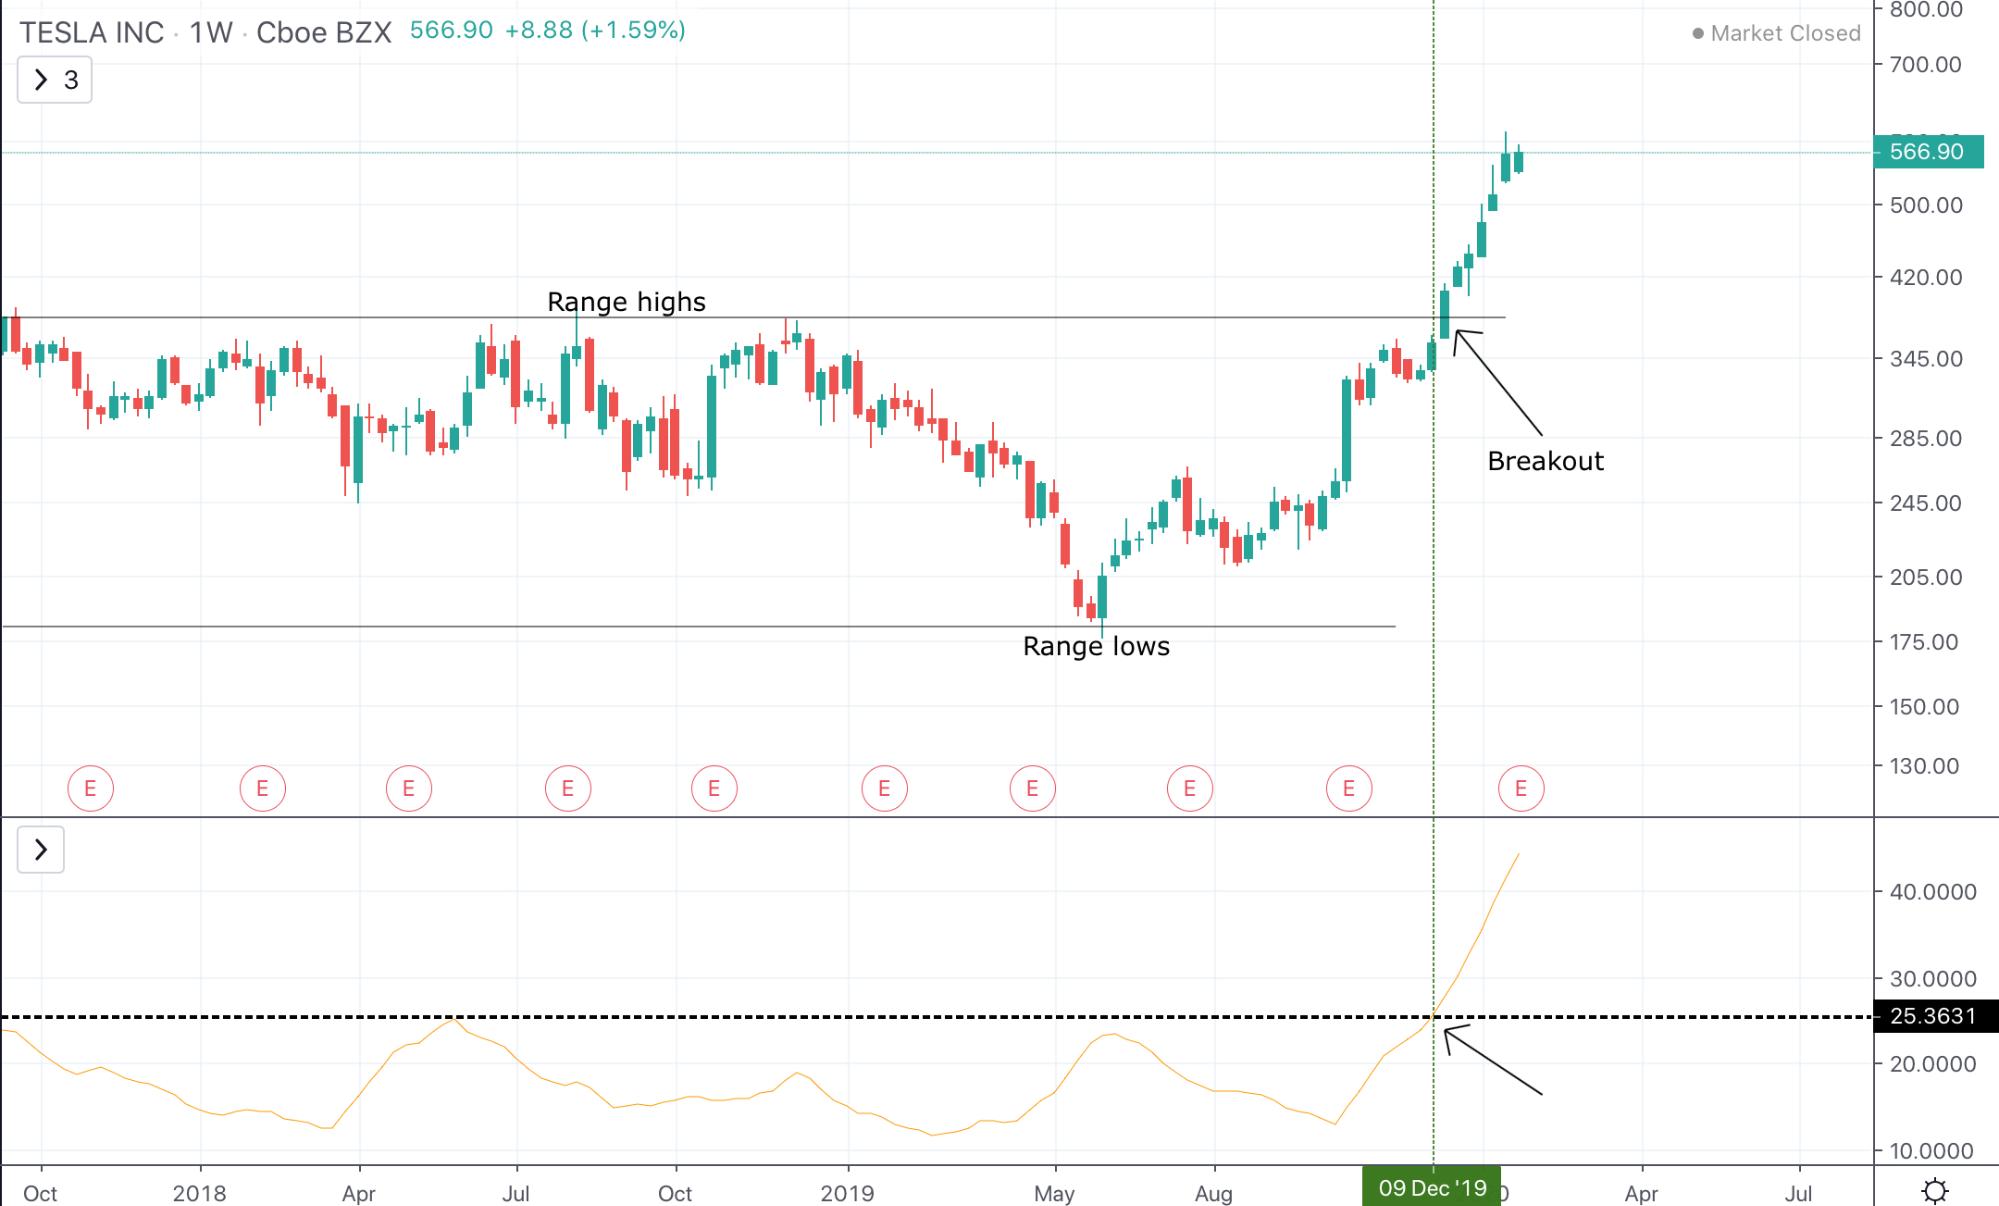
When markets are ranging, different trading techniques need to be applied than that of a strong trend. The ADX can indicate when a trend is absent and a market is likely to continue to chop and range. During this time, traders can alter their trading strategies or wait for a breakout to take a position. In the below example, Tesla can be seen ranging for over a year, followed by a sweep of range lows before heading back into an uptrend with a full breakout to confirm the price action.
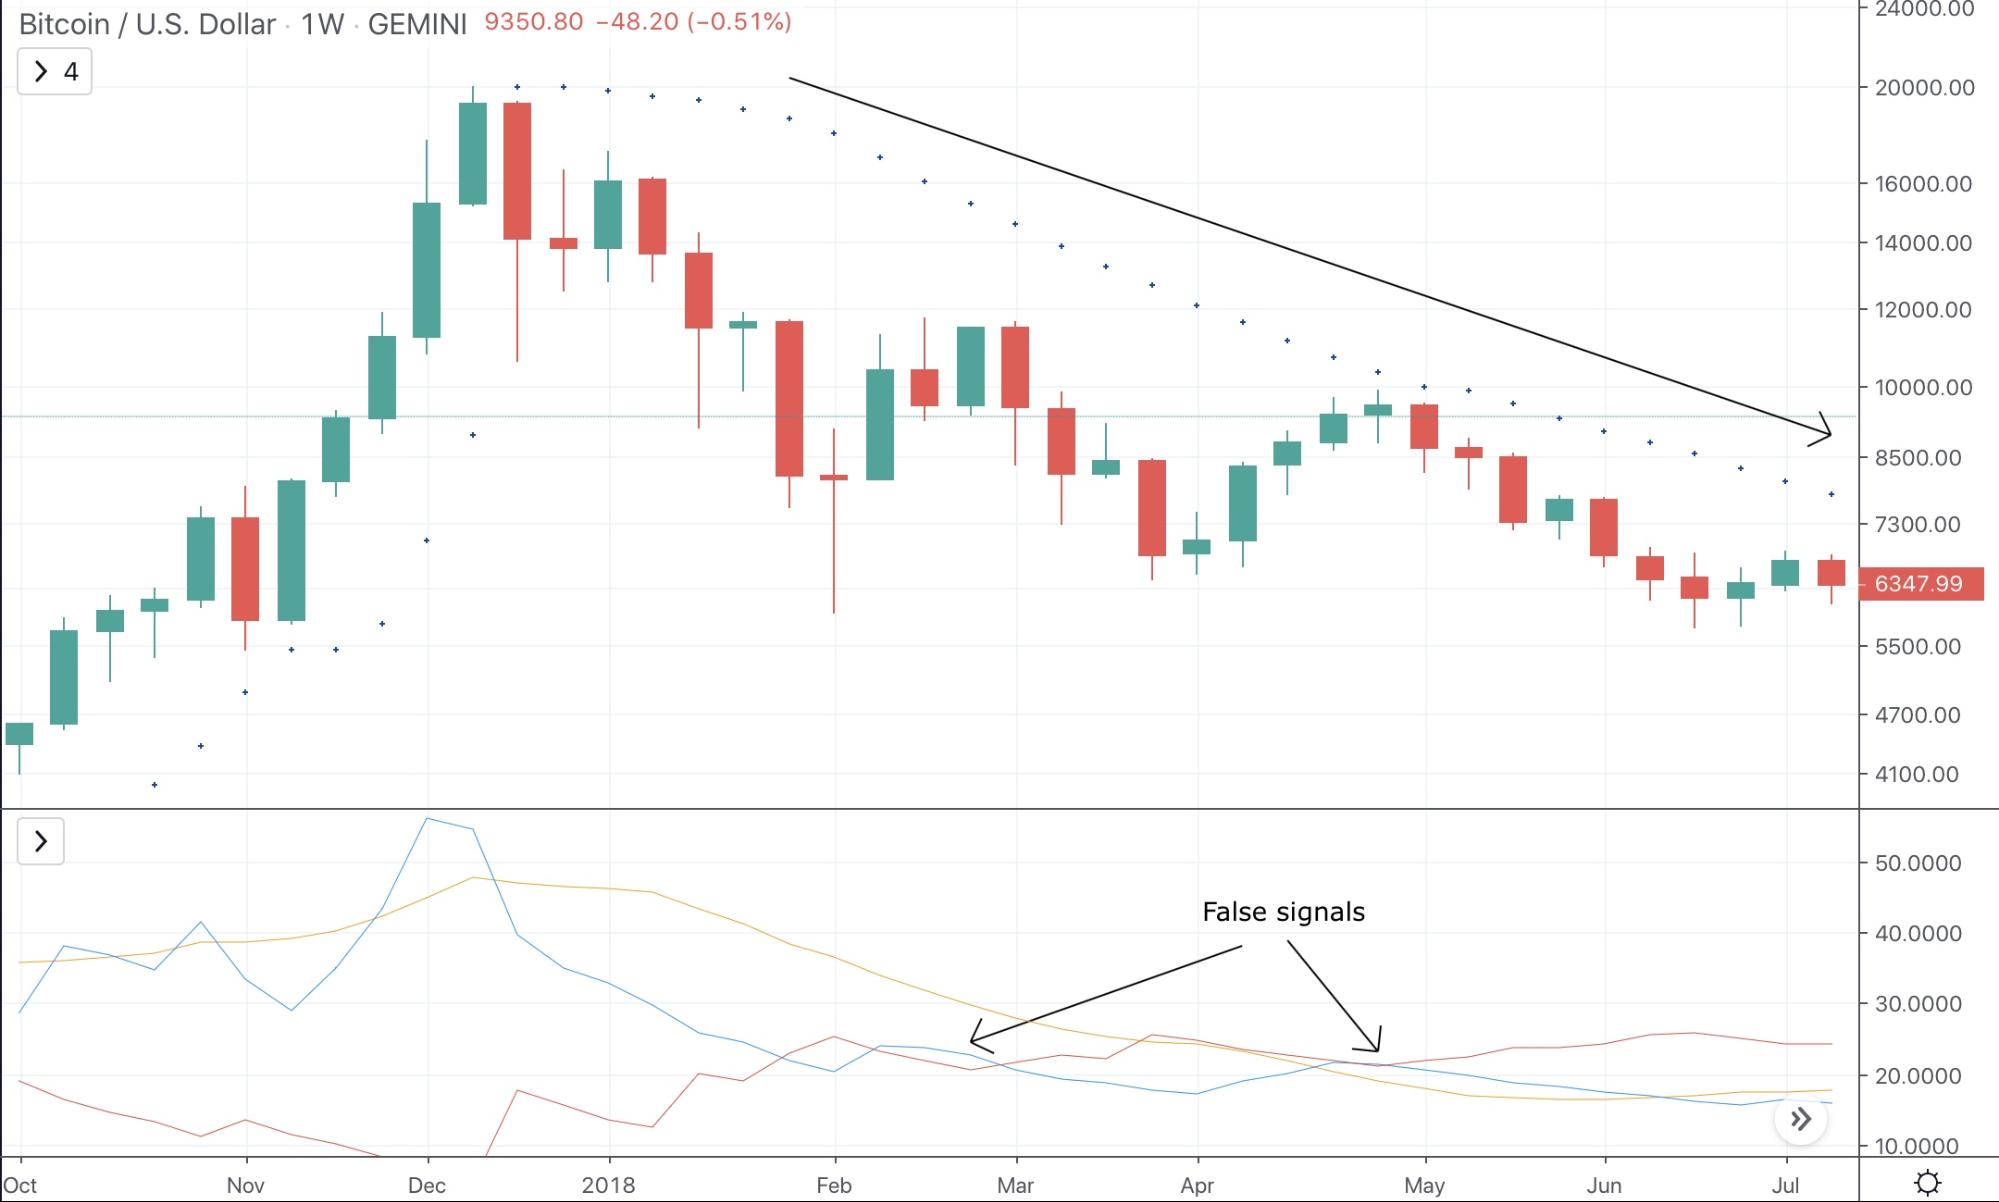
Combining ADX With Parabolic SAR to Filter False Readings
Because signals from the ADXR and in particular each Directional Index can sometimes give false signals, combining the indicator with other tools such as the Parabolic SAR can help to filter out the false readings and provide more conservative signals.
Tips for Traders and Common Mistakes
The most common mistakes traders make are around using the ADX to signal bullish or bearish trends. The tool is designed to measure trend strength but cannot determine what direction the trend goes in. Instead, traders need to rely on the two directional indexes and what information they provide.
Like many lagging indicators, ADX can give false positives. Understanding the limitations of the tool is important as is combining the tool with other indicators such as the Relative Strength Index, Parabolic SAR, and others. Doing so can help to confirm the signals the ADX provides and allow traders to take a more conservative approach to trading.
Conclusion
Now that this guide has fully explained all there is to know about the ADX indicator, it’s time to take your own interpretations of the information and apply it to real-world markets. The Average Directional Index is among the many technical analysis indicators and trading tools available on the PRimeXBT trading platform.
In addition to profit-generating tools such as built-in charting software and the world’s most commonly used indicators, PrimeXBT also features up to 1000x leverage on a wide variety of assets, including stocks, forex, crypto, commodities and more.
The platform also offers a plethora of helpful guides and tutorials to assist you in getting started trading and becoming profitable. Registration is free and quick, and the platform also offers free demo accounts so new traders can practice and hone their skills.
 In today’s fast-paced financial world, responsible trading is no longer a choice; it's a necessity. Technology has opened the markets to everyone, making access incredibly easy.
 For active traders and investors, mastering the art of trading volatility is a crucial skill. Volatility, in financial terms, refers to the extent to which asset prices fluctuate over time. High volatility markets experience rapid price swings...
 The global financial market operates as a dynamic ecosystem, where understanding the connections between different market movements can provide invaluable insights for forecasting...
 The forex market, also known as the foreign exchange market, stands as the largest and most traded financial market globally. FXTM is committed to equipping our clients...
 Cryptocurrency trading has rapidly grown into a bustling and dynamic market that attracts traders from around the world. With the potential for significant profits...