There is a wide range of technical indicators, chart and candlestick patterns that provide signals for newbie and experienced traders. Today we will focus on a reversal candlestick pattern - hammer. It's one of the easiest and most reliable candles that shows that a bearish trend is about to end and a bullish one is ready to begin. Let's see how the pattern looks at the chart and determine how to read its signals.
Hammer Candlestick: What It Is and How to Catch Its Signals
A hammer is a bullish reversal pattern that consists of only one candle. The candle is easily defined as it has a small body and a long lower shadow that exceeds the body at least two times. High and opening/closing prices are almost the same, that's why the candlestick either doesn't have an upper shadow, or the upper shadow is too small.
The candlestick can have any color. Still, if it's bullish, the signal is much stronger because the color shows that not only bears were weak to hold the price low, but bulls were so strong to push the price above its opening level.
A hammer is a bullish reversal pattern that consists of only one candle. It signals a price may reverse after an extended downward movement.
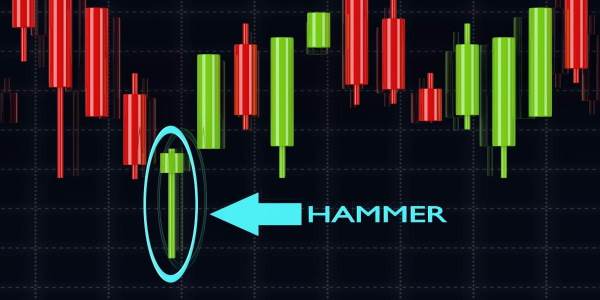
The hammer allows traders to understand where supply and demand are placed. To remember what signals the candlestick provides, just look at its form. A long lower shadow signals that bears tried to push the price down and didn't succeed in holding it at a new low. As a result, the price moved up at the end of the trading, so bulls gained momentum. It’s a sign of a trend reversal.
There are two conditions that can affect the strength of a hammer’s signal:
- The provided signal is more reliable if the candle occurs after a long downtrend. It means that bears are losing their force and can control the market anymore. The length of the downtrend will depend on the period of the chart you trade on.
- The upward signal is more solid if a candlestick that follows a hammer closes above its opening price.
Talking about the hammer pattern, we should mention an inverted hammer. It's also a pattern that consists of only one candle. The candle also has a small body and a shadow that is twice longer than the body. However, the shadow is above the body, not below. The color doesn't affect the signal of the inverted hammer. Still, if it's bullish, the signal is more reliable.
An inverted hammer mirrors opposite the hammer pattern. Still, it provides the same signal as a standard one - a trend reversal.
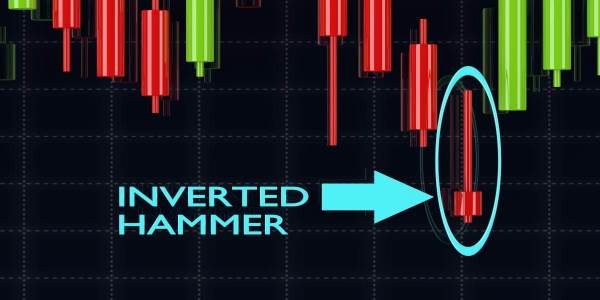
The inverted hammer provides the same signal as a standard one - a trend reversal. However, the inverted hammer is a less reliable pattern and always needs additional confirmation.
Hammer Candlestick Pattern: Find It in Forex
The hammer candle occurs on the price chart often. So, you won't have difficulties looking for it on a chart of any security.
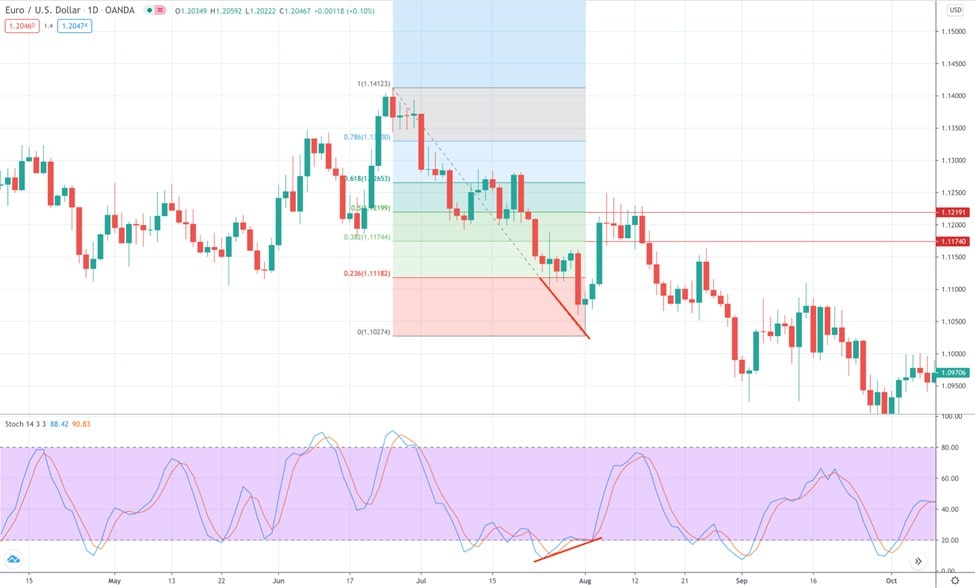
Look at the chart of the daily chart of the EUR/USD pair. There are two examples on one chart that confirms the hammer pattern is one of the most frequent candlestick patterns.
 ​
​
Benefits and Limitations of the Hammer Candlestick Pattern
Any pattern and indicator have advantages and disadvantages. Knowing them, you limit the risks of losing trades.
|
Benefits |
Limitations |
|
Frequency. Hammers occur frequently. Thus, you can easily practice finding them on the price chart. |
No assurance. The hammer signals an upside movement. However, a trader can't be fully sure the bullish trend will occur even after a confirmation candlestick. It can be a short-term price rise. |
|
Easily recognized. You can recognize a hammer pattern without problems. It always has a long lower shadow and a small body. The upper shadow either doesn’t exist or is too small. |
No take profit level. Although the pattern is used to open a trade in the opposite direction to the previous (bearish) trend, the pattern doesn't indicate what reward you will get. You need other patterns and indicators that will provide a take profit level. |
|
Exit the market. Hammers signals when you should exit the market. A hammer is always formed at the end of the downtrend. When seeing a hammer candlestick, a seller can close their trade. |
Confusing. The hammer candlestick resembles a hanging man candle and even a shooting star. |
|
Wait for a reversal. The hammer candlestick is a perfect pattern that predicts a trend reversal. |
Confirmation. As with any other signal, the hammer alerts should be confirmed by other indicators. Otherwise, there is a high risk of fake signals. Another tricky point is that until a buyer waits for a formation of the confirmation candle, they miss a good entry point. Entering the market after the second candle provides a higher risk/reward ratio, where the risk can exceed the ratio dramatically. |
Find the Hammer Candlestick Pattern
In this section, we consider how to identify the hammer pattern on the price chart.
Step 1: Find a Strong Downtrend
Both the hammer and inverted hammer occur at the end of the downtrend. It's vital the downtrend is strong and lasts for long. If the hammer pattern appears after several candlesticks moving down, the risk of a fake signal increases.
Step 2. Define the Length of Shadows
The candle should have a long lower wick (two times bigger than the body) and a small or lack upper wick. If the candlestick has a long upper shadow, it's not a hammer; more likely, it's a doji candlestick. The opposite rule applies to the inverted hammer.
Step 3. Look at Highs and Lows
The hammer’s signal is considered stronger if the hammer is closed below the previous candlestick. Still, if it’s closed within the early candle, the signal is also workable. However, the hammer doesn't work if a new high is set when the candlestick finishes forming. Also, the hammer pattern fails if the following candlestick sets a new low.
Hammer vs. Other Candlesticks
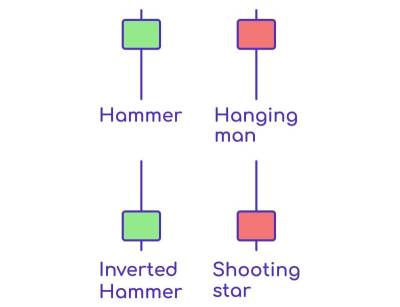
The look of the hammer candlestick is not unique. There are some candles that look similar. That’s why it’s crucial to distinguish them.
The hammer resembles the hanging man candle, while the inverted hammer looks similar to the shooting star.
Hammer and Hanging Man
The hammer and hanging man candlesticks look similar. However, they form in different circumstances. The hammer pattern is a signal of the reversal up. It forms at the end of the downtrend and shows that although bears pulled the price down, they couldn't hold control, and the price closed up.
The hanging man forms when the market is going to move down. It shows that the price is ready to decline after a strong uptrend as the candle has a long lower shadow that depicts the force of bears.
Inverted Hammer and Shooting Star
As both candlesticks are the mirror opposite to the hammer and hanging man candlesticks, they also look similar.
However, the inverted hammer is formed at the end of the downtrend, while the shooting star occurs after a strong uptrend.
Hammer Candle: Catching Its Signals
The key signal of the hammer candle is a price reversal. Still, you can use the hammer pattern for different trading phases.
Take Profit Level
The main signal provided by the hammer is a trend reversal. The candlestick shows that bears have lost their strength, and bulls are ready to control the market. Thus, the candlestick can be used as a good level to exit the market and take profit if you hold a short trade as soon as the hammer is formed.
Entry Point
An entry point can also be defined by using the hammer pattern. Although the candlestick won't provide an accurate level, you can open a long trade after the hammer signal is confirmed. Below you will find information on how to confirm the hammer's signals.
Stop Loss
The hammer candle can be used to define a stop loss level. After the market turns up, you can open a long position. However, it's vital to set a stop loss level any time you trade. Draw a support level through the hammer and previous candlesticks. This level can be set as stop loss.
Still, we would like to remind you that such a way to define a stop loss level can be risky as the risk may exceed reward dramatically.
Best Hammer Candlestick Strategy
There is no best strategy. Still, we have one for you that will open for you another way of using the pattern.
- Step 1. Find a strong downtrend.
- Step 2. Look for the hammer candlestick.
- Step 3. Place Fibonacci retracements from the beginning of the downtrend to the low of the hammer.
- Step 4. Open a long position after you get a confirmation of the upward movement. For this, you can apply RSI or Stochastic Oscillator.
- Step 5. Place take profit at the previous Fibo retracement level. If you are sure the market will keep rising, you can trail your take profit to the next Fibo level.
In the example below, we implemented Stochastic Oscillator. First, the oscillator crossed the oversold area bottom-up. Second, the price and the oscillator formed a bullish divergence, signaling the price increase.
In our example, take profit levels are placed at 1.1174 and 1.1219.
Tips for Traders: Key Points About the Hammer Candlestick Pattern
Always confirm the signal. This rule applies to all patterns and indicators as no trading tool would provide a 100% signal. You will find the most reliable signal by following these rules:
- Apply technical indicators, for instance, RSI or Stochastic Oscillator, to define oversold areas.
- The hammer signal is stronger if it's formed near the support level.
Thus, you can draw a support level, apply pivot points or Fibonacci retracements.
Here are a few other useful guidelines:
- The color doesn't matter. Although the hammer is a bullish pattern, its color doesn't matter. However, if the candle is green (bullish), the signal is stronger.
- The hammer and inverted hammer are both bullish reversal patterns. Still, the inverted hammer provides a weaker signal.
- The size matters. Remember that the lower shadow of the hammer candle and the upper shadow of the inverted hammer should exceed the body at least two times.
Conclusion
To conclude, the hammer is a bullish reversal 1-candle pattern that signals a potential upward movement after a strong downtrend. This pattern is simple and occurs so often that you can practice almost daily seeking it at different timeframes and assets.
However, before trading the pattern, you need to practice. Register a Libertex demo account as it is the best option to train before entering the real market. It covers all the securities and indicators that are available for a real account.
Why to trade with Libertex?
- access to a demo account free of charge
- technical assistance to the operator 5 days a week, from 8 a.m. till 8 p.m. (Central European Standard Time)
- leverage of up to 1:600 for professional Ñlients
- operate on a platform for any device: Libertex and Metatrader
FAQ
It's time to sum up. Check the answers to the following questions.
Is Hammer Bullish or Bearish?
A hammer is a bullish pattern that predicts an upward movement after a downtrend.
Is Red Hammer Bullish?
Although it sounds strange, the red hammer is a bullish pattern. The hammer pattern is bullish in general, and the color doesn't matter. Still, if the candle is green (bullish), the signal is stronger.
What Does Bullish Hammer Mean?
A bullish hammer means that the market is supposed to move up after its formation.
Why Is Inverted Hammer Bullish?
A hammer and an inverted hammer candle are both bullish patterns. Their color and type of hammer candle don't affect their signals.
What Is Inverted Hammer Bullish Reversal?
An inverted hammer bullish reversal is a signal that is given by the inverted hammer. It shows the price will move up after the downward movement.
What Does Bullish Hammer Look Like?
A bullish hammer has a short body and a long lower shadow that is at least two times bigger than the body. The upper shadow may be missing or be small.
What Is an Inverted Hammer Candlestick?
An inverted hammer candle is a kind of hammer candlestick that provides the same signal as the hammer, but it looks opposite to the hammer.
How Do You Trade Hammer Candlestick?
A hammer candlestick signals an upward movement after a downtrend. So, you can either close the sell position or wait for a confirmation of the upward movement to open a buying one.
What Is the Difference Between Hammer and Inverted Hammer?
The only difference is how candlesticks look. The hammer has a long lower shadow, while the inverted hammer has a long upper shadow.
What Is the Difference Between Inverted Hammer and Shooting Star?
The inverted hammer candle is formed at the end of the downtrend. The shooting star occurs at the end of the uptrend.
 In today’s fast-paced financial world, responsible trading is no longer a choice; it's a necessity. Technology has opened the markets to everyone, making access incredibly easy.
 For active traders and investors, mastering the art of trading volatility is a crucial skill. Volatility, in financial terms, refers to the extent to which asset prices fluctuate over time. High volatility markets experience rapid price swings...
 The global financial market operates as a dynamic ecosystem, where understanding the connections between different market movements can provide invaluable insights for forecasting...
 The forex market, also known as the foreign exchange market, stands as the largest and most traded financial market globally. FXTM is committed to equipping our clients...
 Cryptocurrency trading has rapidly grown into a bustling and dynamic market that attracts traders from around the world. With the potential for significant profits...